The monthly market shares of General Electric Company for 12 consecutive months follow. A. Construct a time series plot. What type of pattern exists in the data? B. Develop three-month and four-month moving averages for this time series. Does the three-month or the four-month moving average provide the better forecasts based on MSE? Explain your reasoning. C. Using your results in (B), compute MAD, MAPE, and Tracking Signal (TS). Which method provides better forecast? Explain your reasoning. Assume TS limit of ±4. D. Apply exponential smoothing to the data. Compute MSE, MAPE, MAD, and TS. Use a = 0.3. How does exponential smoothing compare with four-month moving average? Assume TS limit of ±4. Month 1 2 3 4 5 6 7 8 9 SEEL 10 11 12 Market Shares 23.39 23.56 23.02 23.03 23.60 23.37 23.21 23.40 23.31 23.94 23.39 23.50
The monthly market shares of General Electric Company for 12 consecutive months follow. A. Construct a time series plot. What type of pattern exists in the data? B. Develop three-month and four-month moving averages for this time series. Does the three-month or the four-month moving average provide the better forecasts based on MSE? Explain your reasoning. C. Using your results in (B), compute MAD, MAPE, and Tracking Signal (TS). Which method provides better forecast? Explain your reasoning. Assume TS limit of ±4. D. Apply exponential smoothing to the data. Compute MSE, MAPE, MAD, and TS. Use a = 0.3. How does exponential smoothing compare with four-month moving average? Assume TS limit of ±4. Month 1 2 3 4 5 6 7 8 9 SEEL 10 11 12 Market Shares 23.39 23.56 23.02 23.03 23.60 23.37 23.21 23.40 23.31 23.94 23.39 23.50

Practical Management Science
6th Edition
ISBN:9781337406659
Author:WINSTON, Wayne L.
Publisher:WINSTON, Wayne L.
Chapter13: Regression And Forecasting Models
Section13.7: Exponential Smoothing Models
Problem 26P: The file P13_26.xlsx contains the monthly number of airline tickets sold by the CareFree Travel...

Related questions
Question

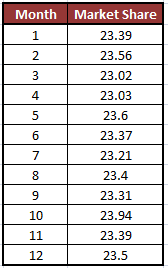
Transcribed Image Text:The monthly market shares of General Electric Company for 12
consecutive months follow.
A. Construct a time series plot. What type of pattern exists in the
data?
B. Develop three-month and four-month moving averages for
this time series. Does the three-month or the four-month
moving average provide the better forecasts based on MSE?
Explain your reasoning.
C. Using your results in (B), compute MAD, MAPE, and
Tracking Signal (TS). Which method provides better forecast?
Explain your reasoning. Assume TS limit of ±4.
D. Apply exponential smoothing to the data. Compute MSE,
MAPE, MAD, and TS. Use a = 0.3. How does exponential
smoothing compare with four-month moving average?
Assume TS limit of ±4.
Month
1
2
3
4
5
6
7
8
9
10
11
12
Market
Shares
23.39
23.56
23.02
23.03
23.60
23.37
23.21
23.40
23.31
23.94
23.39
23.50
Expert Solution
Step 1
Given data-

Trending now
This is a popular solution!

Step by step
Solved in 2 steps with 6 images

Recommended textbooks for you
Practical Management Science
Operations Management
ISBN:
9781337406659
Author:
WINSTON, Wayne L.
Publisher:
Cengage,

Contemporary Marketing
Marketing
ISBN:
9780357033777
Author:
Louis E. Boone, David L. Kurtz
Publisher:
Cengage Learning

Marketing
Marketing
ISBN:
9780357033791
Author:
Pride, William M
Publisher:
South Western Educational Publishing
Practical Management Science
Operations Management
ISBN:
9781337406659
Author:
WINSTON, Wayne L.
Publisher:
Cengage,
Contemporary Marketing
Marketing
ISBN:
9780357033777
Author:
Louis E. Boone, David L. Kurtz
Publisher:
Cengage Learning
Marketing
Marketing
ISBN:
9780357033791
Author:
Pride, William M
Publisher:
South Western Educational Publishing