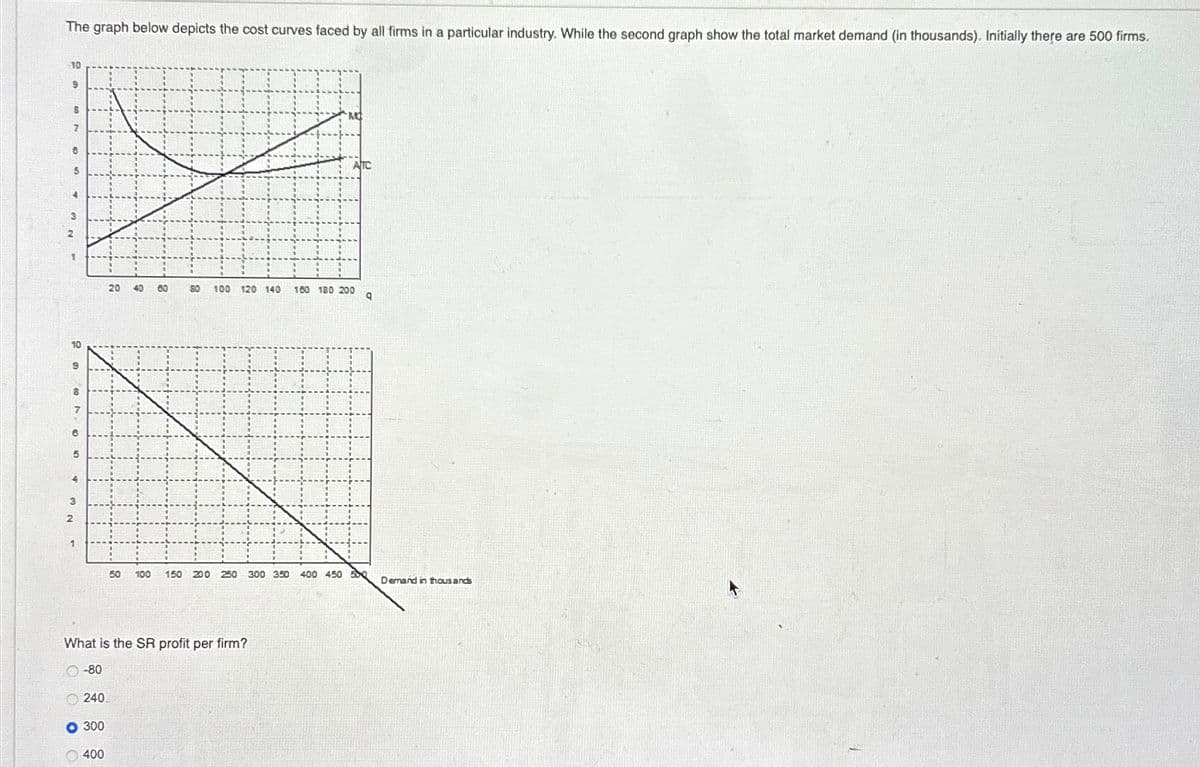
The graph below depicts the cost curves faced by all firms in a particular industry. While the second graph show the total market demand (in thousands). Initially there are 500 firms. 10 B N 5 20 40 60 80 100 120 140 160 180 200 9 50 100 150 200 250 300 350 400 450 500 Demand in thousands What is the SR profit per firm? -80 240 0300 400


Q: As a project engineer, you received the AW analysis below from the finance department. It is for a…
A: The objective of the question is to determine the first cost (P) and the salvage value (S) of a…
Q: Market demand is MWTP= 50 - 2Q. Market supply is MC = 4 + 2Q. Each unit transacted results in a $Q…
A: Referencehttps://www.investopedia.com/terms/m/marginal-revenue-mr.asp
Q: A person has $25 to spend on apples, bananas, and cherries. Their respective prices are $2, $3, and…
A: The budget constraint for a person spending $25 on apples, bananas, and cherries, with prices of $2,…
Q: Please solve ones that were marked incorrect (x).
A: Answers: Answer a: Let's represent the number of advertisements for television, radio, and online as…
Q: The wow expert Hand written solution is not allowed
A: In a dominant strategy equilibrium, each player chooses their strategy regardless of the other…
Q: Which of the following explain why the Aggregate Demand Curve slopes downward? Mark all that apply.…
A: The objective of the question is to identify the reasons why the Aggregate Demand Curve slopes…
Q: Suppose that a competitive firm's marginal cost of producing output q (MC) is given by Assume that…
A: Competitive Firm and Profit Maximization:In a perfectly competitive market, firms are price-takers,…
Q: WAGE RATE Aplia Homework: Labor Markets and Labor Unions Consider the housing construction industry.…
A: Detailed explanation:Based on the graph, the union's wage increase from $24 to $32 per hour causes…
Q: Assume you were provided the following information for a monopolist: Inverse Demand Function: P =…
A: To find the profit-maximizing level of output for the monopolist, we need to determine the quantity…
Q: Barbara borrowed a certain amount of money and repaid the loan with ten payments. The first five of…
A: Step 1: Calculate the present value of the first five payments.The present value of an annuity due…
Q: The data below represent a demand schedule. Product Price Quantity Demanded 10 15 $ 30 25 20 20 15…
A: To determine the price elasticity of demand between different price points using the midpoint…
Q: Please answer all the highlighted blanks
A: Spreadsheet Model for Business Intelligence SymposiumPart (a): Profit CalculationHere's the…
Q: You decide to take $600 out of your piggy bank at home and place it in the bank. If the reserve…
A: The objective of the question is to determine the potential increase in the money supply in the…
Q: Market demand is MWTP= 76 - 2Q. Market supply is MC = 12 + Q. Each unit transacted results in a $Q…
A: Given information: Market demand :MWTP= 76 - 2Q. Market supply:MC = 12 + Q Finding the social…
Q: In the 1960s, water was inexpensive. However, by 1965 Canada saw one of the country’s worst…
A: 2- Price Elasticity of Demandi) Wheat: Inelastic in the short termJustification: Wheat is a vital…
Q: Explain why a voluntary army may be less expensive to society than an army composed of draftees.…
A: For a number of reasons, a voluntary army—one in which people enlist voluntarily—may be less costly…
Q: Consider a homogeneous product industry with three firms 1, 2, and 3 that engage in simultaneous…
A: Step 1:a. Given informationIn a simultaneous quantity competition, each firm chooses its quantity…
Q: Typed please and asap please provide a quality solution for better ratings
A: To find the equilibrium price in both the U.S. and Japanese markets, we need to apply the profit…
Q: None
A: To thoroughly analyze and explain the solution to the decision problem between Machine A and Machine…
Q: The following table shows Carly and Emma's maximum willingness to pay for paint supplies and drawing…
A: Step 1: To find producer surplus, determine market demand for each good (individually and bundled),…
Q: The wow expert Hand written solution is not allowed.
A: Ans. ) Given the question, it is said that economy is currently producing at it potential output.…
Q: When the Fed supplies "too much" monetary stimulus in the face of a negative aggregate demand shock:…
A: When the Federal Reserve responds to a negative aggregate demand shock by supplying "too much"…
Q: For some years, Mel has contracted with several major pizza retailers for home delivery services. He…
A: Here's a brief explanation of the process:Calculate Costs and Revenues: Identify all relevant costs…
Q: Urgent help
A: Option d: This option is correct d) NeoclassicalNeoclassical Economics is an approach to economics…
Q: just subpart d please
A: The introduction of the Family Tax Credit (FTC) in New Zealand can influence a working mother's…
Q: Refer to Figure 6.3. On this graph, area BCEO represents: OA. producer surplus. OB. total surplus…
A: In the given figure, the x-axis represents the quantity of a good or service, and the y-axis…
Q: None
A: Step 1: Meaning of price floor and price ceilingPrice floor: It is the minimum price set by the…
Q: None
A: Explanation is as follows:The sticky-wage theory suggests that in the short-run, nominal wages (the…
Q: How must the following cost and requirements table for a transportation problem be altered so that…
A:
Q: Don't use chatgpt, I will 5 upvotes Refer to Figure 14-1. If the market price is P2, in the short…
A: In the short run, if the market price is P2, the perfectly competitive firm will earn zero economic…
Q: Figure 34-3 PRICE LEVEL aaa" LRAS B Y, Y₂ QUANTITY OF OUTPUT SRAS. SRAS AD Refer to Figure 34-3. In…
A: In the Aggregate Demand-Aggregate Supply (AD-AS) model, short-run and long-run equilibrium refer to…
Q: Part 1. Suppose that you overhear a foursome of physicians on the golf course discussing the prices…
A: Part 1: Such an agreement among physicians to all charge the same fee for an office visit is called…
Q: ?Question 2.10: Calculate Growth Rate of Real Per Capita GDP Now suppose there are more goods and…
A: Step 1: Real GDP Per Capita:The average economic production per person, adjusted for inflation, is…
Q: None
A: area of triangle is calculated by the formulaArea of triangle=21∗(base)∗(height) Here, In the graph…
Q: None
A: b. To calculate how many spending cycles would occur before consumer spending increased by $200…
Q: None
A: 1. GDP (Gross Domestic Product) is a crucial economic indicator that measures the total value of all…
Q: Suppose that Paul Atreides scored 41.5 on Exam 2. If everyone’s exam scores follow a normal…
A: The objective of the question is to find the probability that someone else's score is higher than…
Q: In general, interest groups and social movements organize citizens according to non- territorial…
A: The first statement is true. Interest groups and social movements do organize citizens according to…
Q: In a mechanical drive system, what effect does inefficiency have on the output when compared to the…
A: In a mechanical drive system, efficiency refers to how effectively it converts input energy into…
Q: a. Are the following statements true or false? Explain your reasons. For a firm with price in excess…
A: a.1.According to economic theory, businesses should raise production only when marginal cost is…
Q: Urban Economics, problem set 1 2. (You may handwrite the answer to this question.) This question is…
A: 2. Average cost can be defined as a function of output (q) or it can be a constant depending on the…
Q: The accompanying diagram shows the demand and supply curves for taxi rides in New York City. Uber's…
A:
Q: Figure 34-3 PRICE LEVEL a a a LRAS Y, Y₂ QUANTITY OF OUTPUT SRAS. SRAS. AD Refer to Figure 34-3.…
A: At point B, the economy is in short-run equilibrium, as it is the point where the short-run…
Q: Question One The figure below shows three alternative distributions of land ownership in a village…
A:
Q: In the 1960s, water was inexpensive. However, by 1965 Canada saw one of the country’s worst…
A: i. The 1965-1966 Canadian drought had a major effect on the wheat and water markets:Water Market:…
Q: Tyrone wants to spend $15,000 on a new car three years from now. He opens a savings account and…
A: To provide a more thorough explanation of how we arrived at the solution, let's dissect the…
Q: None
A: The elasticity of demand, E, is a measure of the responsiveness of demand to changes in price. It is…
Q: e. A firm in a given industry has an incentive to use the new technology if and only if the expected…
A: Industrial economics is a branch of economics in which industrial matters are analyzed with the help…
Q: Graphically explain the model of buyer behaviour?
A: The way consumers make decisions when buying products is often described as a process involving…
Q: Macmillan Learning Cola DUDDies, L.e., cola encased in cuivie membranes, emmnaung the need for…
A: b.The patent office should grant patents for the gene predictor and the cola bubbles. This is…


Trending now
This is a popular solution!

Step by step
Solved in 2 steps

- Shakti Inc. has been granted a patent for its arnica toothache balm. The table to the right shows the demand and the total cost schedule for the firm. What is Shakti's profit minus maximizingoutput? A. 4 units B. 6 units C. 7 units D. 5 units Price per dose (Dollars) Quantity Demanded (Dose) Total Cost of Production (Dollars) $80 0 $80 72 1 82 64 2 88 56 3 100 48 4 124 40 5 164 32 6 208 24 7 268 16 8 340Using the graph below, calculate the firm's profits at the profit maximizing output Price 408 384 360 336 312 288 264 240 216 192 168 144 120 96 72 48 24 0 0 56 112 168 224 280 336 392 448 504 560 616 672 728 784 840 896 Quantity -PMRMC-ACOutput AFC AVC ATC MC 1 300 100 400 100 2 150 75 225 50 3 100 70 170 60 4 75 73 148 80 5 60 80 140 110 6 50 90 140 140 7 43 103 146 180 8 38 119 156 230 9 33 138 171 290 10 30 160 190 360 Refer to the chart above. If the market price is $179, the per-unit economic profit at the profit maximizing output is what? 15 23 33 39
- The following graph depicts the costs incurred by a Local egg seller, Rahim. Rahim is faced with strong competitors who are selling exactly the same product. Use the graph to answer the following questions- Price/Cost per egg MC 12 ATC MR3 AVC MR2 MR1 Quantity 100 200 300 400 a)lf the market price per egg is 8tk, in order to maximize profit how many eggs does Rahim sell? b)lf the price stays at 8tk, what happens in the long run? choose from the following options. option 1: Rahim stops selling eggs. option 2 : New firms enter into the egg market option 3: all existing sellers suffer from an economic loss. c)lf the price falls down to 3tk price, which of the following option does Rahim have in short run? option1: Temporarily shutting down the business business option 2 : staying in generating no profit option 3: indifferent between staying in and going Out of the market. but2:08 1 .ull LTE AA A moodle.ku.edu.kw MC $19 16 13 10 160 180 210 Quantity 100 Refer to the diagram for a monopolistically competitive firm in short-run equilibrium. This firm's profit- maximizing price will be IIIA firm on competitive market has the data about cost as below Q,0, 1, 2, 3, 4, 5, 6, 7, 8, 9, 10, 11, 12, 13, 14 TC 100160208254290320340355370390430475525580640 a. Form a table with numbers about: total revenue, average cost, average variable cost and marginal cost of this firm. Determine the quantity that this firm will shutdown b. To maximize the profit, what will be the output of this firm if the price of product is 45 and if the price is 50. c. Determine the supply curve of this firm 3. A firm on competitive market has the data about cost as below Q 0 1 2 3 4 5 6 7 8 9 10 11 12 13 14 TC 100 160 208 254 290 320 340 355 370 390 430 475 525 580 640 a. Form a table with numbers about: total revenue, average cost, average variable cost and marginal cost of this firm. Determine the quantity that this firm will shutdown b. To maximize the profit, what will be the output of this firm if the price of product is 45 and if the price is 50. C. Determine the supply curve of this firm
- MonoMed, having a Patent on production of a medicine, has following Demand and Cost Schedule : Price (Rs ) 12 11 10 9 8 7 6 5 4 3 Quantity 0 1 2 3 4 5 6 7 8 9 TVC ( Rs ) 0 13 16 20 25 31 38 46 56 68 Where Fixed Cost is Rs 5 d. Calculate the profit earned, if any and show the area on the firm’s graph.17 of 16 BNW is one of many producers of luxury wheelchairs, which are differentiated to appeal to different market niches. BNW's Price per chair relevant demand and cost curves are depicted in the graph. $2,000 Average total Use this graph to answer the questions. Assume that there are 1,800 Marginal cost no significant barriers to entry. cost 1,600 Determine BNW's profit-maximizing price and quantity. 1,400 1,200 1,000 price per chair: $ 800 600 400 quantity of chairs: chairs 200 Demand Marginal revenue 100 200 300 400 500 600 700 800 900 Calculate BNW's profit. Chairs per week BNW's profit: $The global pandemic 2020 has promoted a race to capture the market for introducing effective vaccine and treatments. a. If PFIZER is the sole vaccine provider given the following information, answer the questions below: Output Price/Unit Total Cost 1 5500 1000 2 5000 1200 3 4500 1500 4 4000 2500 5 3500 4000 6 3000 5700 7 2500 7500 8 2000 9400 9 1500 11400 10 1000 13500 Given the tabular information above find the profit-maximizing output and price also illustrate the same using the two-dimensional labeled diagram. Show the calculation as well. b. Assume if many firms enter into the business of providing vaccine determine: How the demand curve of PFIZER would change and how it would now maximize its profit? The kind of market structure now PFIZER…
- The table below shows the information on Ilham Bakery. Item AmountRevenue in operating the bakery shop RM 80 000Income that could have been earned if working as an employee to others RM 7 000Utility cost RM 1 200Salary of workers RM 15 000Cost of raw materials RM 20 000 What is the economic profit?onsider the table below and assume the market price is $35 per unit. Totalproduct Totalfixed cost TotalVariablecost 0 150 0 1 150 50 2 150 75 3 150 112.4 4 150 150 5 150 200 6 150 270 7 150 360 8 150 475 9 150 620 10 150 800 Now assume there are 600 identical firms in this industry, that is, there are 600 firms, each of which has the same cost data as the single firm discussed above. Suppose, too, that the demand curve for this industry is as follows: Price Quantitydemanded $20 6,800 30 5,975 45 5,500 60 5,125 75 4,500 95 4,200 120 3,600 150 2,400 In equilibrium each firm will realize: Multiple Choice an economic profit of $155. a loss of $45. an economic profit of $35. a loss of $135.the table below shows the output cost and revenue situation of a firm. Study the table and asnwer the questions that fllows Q TVC TC MC P TR MR 0 0 150 0 200 0 - 1 110 C 110 175 175 175 2 170 320 G 150 I L 3 A D 46 135 405 105 4 250 E 34 120 J M 5 B 445 H 105 525 45 360 F 65 90 K N (a) what is the fixed cost of the firm? Explain your answer (b) determine the values from A-M by showing all workings employed (c) At what quantity and price is the firm in equilibrium position and in what market is the firm oeperating? explain your answer