Practical Management Science
6th Edition
ISBN: 9781337406659
Author: WINSTON, Wayne L.
Publisher: Cengage,
expand_more
expand_more
format_list_bulleted
Question
Please answer the question attached below! Thanks!

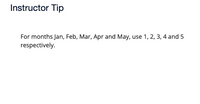
Transcribed Image Text:**Instructor Tip**
For months Jan, Feb, Mar, Apr, and May, use 1, 2, 3, 4, and 5 respectively.
 method, the trend equation for forecasting is (round your responses to two decimal places):
\[
\hat{y} = \Box + \Box x
\]
### Definition
This approach results in a straight line that minimizes the sum of the squares of the vertical differences or deviations from the line to each of the actual observations.
A least-squares line is described in terms of its y-intercept (the height at which it intercepts the y-axis) and its expected change (slope).](https://content.bartleby.com/qna-images/question/486f0abb-f9b2-484f-831d-c29988945553/1430f8c6-0a99-444f-8b51-9bf970b46a3c/6sa8fib_thumbnail.png)
Transcribed Image Text:The following gives the number of accidents that occurred on Florida State Highway 101 during the last 4 months:
| Month | Jan | Feb | Mar | Apr |
|--------------------|-----|-----|-----|-----|
| Number of Accidents| 30 | 40 | 60 | 95 |
Using the [least-squares regression](#) method, the trend equation for forecasting is (round your responses to two decimal places):
\[
\hat{y} = \Box + \Box x
\]
### Definition
This approach results in a straight line that minimizes the sum of the squares of the vertical differences or deviations from the line to each of the actual observations.
A least-squares line is described in terms of its y-intercept (the height at which it intercepts the y-axis) and its expected change (slope).
Expert Solution
This question has been solved!
Explore an expertly crafted, step-by-step solution for a thorough understanding of key concepts.
This is a popular solution
Trending nowThis is a popular solution!
Step by stepSolved in 2 steps

Knowledge Booster
Similar questions
- 2. True or False: You must offer the person a choice of service providers.arrow_forwardWhat are service-level agreements (SLAs) and how are they important in the context of providing and consuming services?arrow_forwardOnline services may be divided into two broad categories: those that need special software in order to be used, and those that anybody with internet connection can use. Many options exist, but which one stands out as the best?arrow_forward
- What are service enhancement?arrow_forwardWhat does "software as a service" really mean?arrow_forwardTwo distinct application support services may each be offered through the internet, albeit this is just a possibility and not a given. How do these products vary from one another, and what makes them stand out from others on the market?arrow_forward
- Explain the concept of service discovery and its importance in a service-oriented system.arrow_forwardUsing the Flower of service model how would i would explain how the core product and supplementary services are integrated in the context of an overnight hotel stay?arrow_forwardIn order to be effective, what four tasks do service settings have to complete?arrow_forward
arrow_back_ios
SEE MORE QUESTIONS
arrow_forward_ios
Recommended textbooks for you
 Practical Management ScienceOperations ManagementISBN:9781337406659Author:WINSTON, Wayne L.Publisher:Cengage,
 Operations ManagementOperations ManagementISBN:9781259667473Author:William J StevensonPublisher:McGraw-Hill Education
 Operations and Supply Chain Management (Mcgraw-hi...Operations ManagementISBN:9781259666100Author:F. Robert Jacobs, Richard B ChasePublisher:McGraw-Hill Education
 Purchasing and Supply Chain ManagementOperations ManagementISBN:9781285869681Author:Robert M. Monczka, Robert B. Handfield, Larry C. Giunipero, James L. PattersonPublisher:Cengage Learning
 Production and Operations Analysis, Seventh Editi...Operations ManagementISBN:9781478623069Author:Steven Nahmias, Tava Lennon OlsenPublisher:Waveland Press, Inc.

Practical Management Science
Operations Management
ISBN:9781337406659
Author:WINSTON, Wayne L.
Publisher:Cengage,

Operations Management
Operations Management
ISBN:9781259667473
Author:William J Stevenson
Publisher:McGraw-Hill Education

Operations and Supply Chain Management (Mcgraw-hi...
Operations Management
ISBN:9781259666100
Author:F. Robert Jacobs, Richard B Chase
Publisher:McGraw-Hill Education


Purchasing and Supply Chain Management
Operations Management
ISBN:9781285869681
Author:Robert M. Monczka, Robert B. Handfield, Larry C. Giunipero, James L. Patterson
Publisher:Cengage Learning

Production and Operations Analysis, Seventh Editi...
Operations Management
ISBN:9781478623069
Author:Steven Nahmias, Tava Lennon Olsen
Publisher:Waveland Press, Inc.