The figure below gives F() for some function F. C Use this graph and the facts that the area labeled A is 2, that labeled B is 8, that labeled C is 6.5, and that F(2) -3 to sketch the graph of F(a). Label the values of at least four points. Then, using your graph, give four (2, 3) points on the curve: (Give your answer as a list of points separated by commas.)
The figure below gives F() for some function F. C Use this graph and the facts that the area labeled A is 2, that labeled B is 8, that labeled C is 6.5, and that F(2) -3 to sketch the graph of F(a). Label the values of at least four points. Then, using your graph, give four (2, 3) points on the curve: (Give your answer as a list of points separated by commas.)

Related questions
Question
Needs Complete solution with 100 % accuracy don't use chat gpt or ai i definitely upvote you be careful Downvote for ai or chat gpt answer.
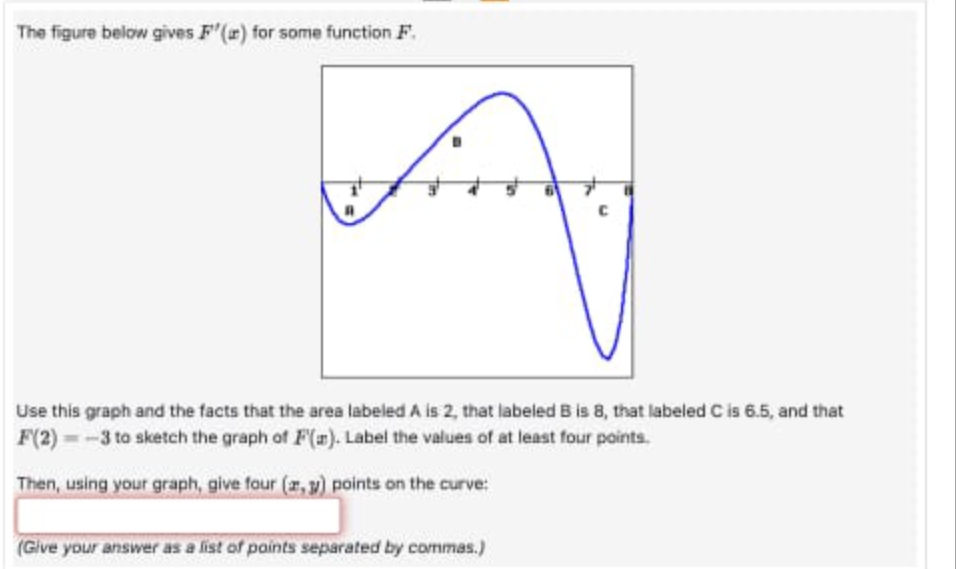
Transcribed Image Text:The figure below gives F() for some function F.
C
Use this graph and the facts that the area labeled A is 2, that labeled B is 8, that labeled C is 6.5, and that
F(2) -3 to sketch the graph of F(a). Label the values of at least four points.
Then, using your graph, give four (2, 3) points on the curve:
(Give your answer as a list of points separated by commas.)
Expert Solution
This question has been solved!
Explore an expertly crafted, step-by-step solution for a thorough understanding of key concepts.

This is a popular solution!

Trending now
This is a popular solution!

Step by step
Solved in 2 steps
