6.92 334.5 6.17 1049.9 4.88 485.1 4.49 289.6 3.98 551.8 3.74 288.9 3.25 295.2 3.15 500.1 2.76 611.0 2.64 1311.5 2.59 413.8 2.25 263.2 2.23 490.7 0.99 204.2 0.84 491.7 0.64 74.2 0.52 240.6 0.30 56.6 Compute the least-squares line for predicting y from x. Make a plot of residuals versus fitted values. a. b. Compute the least-squares line for predicting y from In x. Make a plot of residuals versus fitted values. Compute the least-squares line for predicting In y from In x. Make a plot of residuals versus fitted values. C. d. Which of the three models (a) through (c) fits best? Explain. Using the best model, predict the peak flow when the discharge is 50.0 km?lyr. e. f. Using the best model, find a 95% prediction interval for the peak flow when the discharge is 50.0 kmlyr. The article "Characteristics and Trends of River Discharge into Hudson, James, and Ungava Bays, 1964-2000" (S. Dery, M. Stieglitz, et al., Journal of Climate, 2005:2540-2557) presents measurements of discharge rate x (in kmlyr) andpeakflow y (in m/s) for 42 rivers that drain into the Hudson, James, and Ungava Bays. The data are shown in the following table: Discharge Peak Flow 94.24 4110.3 66.57 4961.7 59.79 10275.5 48.52 6616.9 40.00 7459.5 32.30 2784.4 31.20 3266.7 30.69 4368.7 26.65 1328.5 22.75 4437.6 21.20 1983.0 20.57 1320.1 19.77 1735.7 18.62 1944.1 17.96 3420.2 17.84 2655.3 16.06 3470.3 1561.6 14.69 11.63 869.8 11.19 936.8 11.08 1315.7 10.92 1727.1 9.94 768.1 7.86 483.3
6.92 334.5 6.17 1049.9 4.88 485.1 4.49 289.6 3.98 551.8 3.74 288.9 3.25 295.2 3.15 500.1 2.76 611.0 2.64 1311.5 2.59 413.8 2.25 263.2 2.23 490.7 0.99 204.2 0.84 491.7 0.64 74.2 0.52 240.6 0.30 56.6 Compute the least-squares line for predicting y from x. Make a plot of residuals versus fitted values. a. b. Compute the least-squares line for predicting y from In x. Make a plot of residuals versus fitted values. Compute the least-squares line for predicting In y from In x. Make a plot of residuals versus fitted values. C. d. Which of the three models (a) through (c) fits best? Explain. Using the best model, predict the peak flow when the discharge is 50.0 km?lyr. e. f. Using the best model, find a 95% prediction interval for the peak flow when the discharge is 50.0 kmlyr. The article "Characteristics and Trends of River Discharge into Hudson, James, and Ungava Bays, 1964-2000" (S. Dery, M. Stieglitz, et al., Journal of Climate, 2005:2540-2557) presents measurements of discharge rate x (in kmlyr) andpeakflow y (in m/s) for 42 rivers that drain into the Hudson, James, and Ungava Bays. The data are shown in the following table: Discharge Peak Flow 94.24 4110.3 66.57 4961.7 59.79 10275.5 48.52 6616.9 40.00 7459.5 32.30 2784.4 31.20 3266.7 30.69 4368.7 26.65 1328.5 22.75 4437.6 21.20 1983.0 20.57 1320.1 19.77 1735.7 18.62 1944.1 17.96 3420.2 17.84 2655.3 16.06 3470.3 1561.6 14.69 11.63 869.8 11.19 936.8 11.08 1315.7 10.92 1727.1 9.94 768.1 7.86 483.3

Glencoe Algebra 1, Student Edition, 9780079039897, 0079039898, 2018
18th Edition
ISBN:9780079039897
Author:Carter
Publisher:Carter
Chapter10: Statistics
Section10.6: Summarizing Categorical Data
Problem 31PPS

Related questions
Question

Transcribed Image Text:6.92
334.5
6.17
1049.9
4.88
485.1
4.49
289.6
3.98
551.8
3.74
288.9
3.25
295.2
3.15
500.1
2.76
611.0
2.64
1311.5
2.59
413.8
2.25
263.2
2.23
490.7
0.99
204.2
0.84
491.7
0.64
74.2
0.52
240.6
0.30
56.6
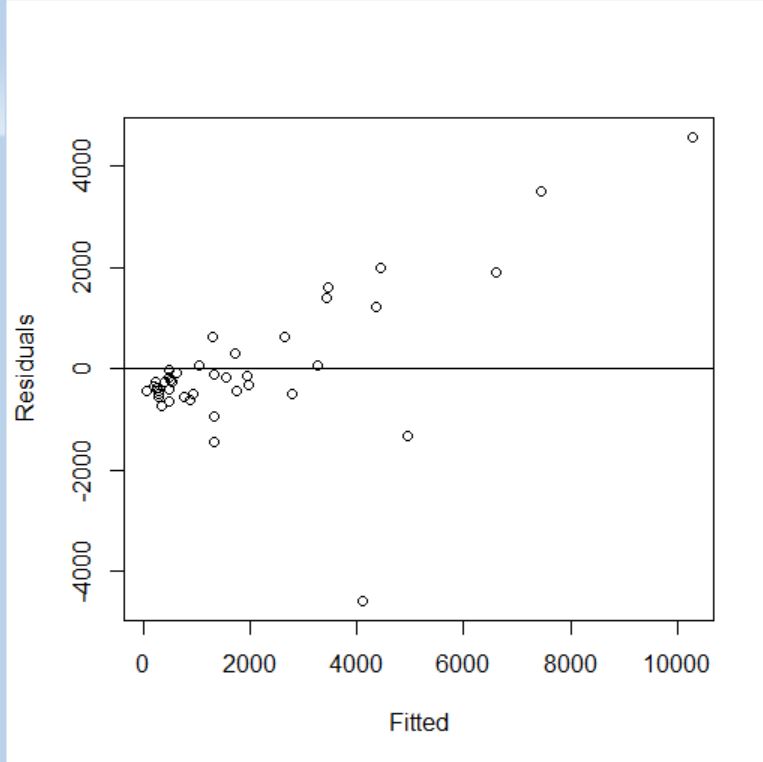
Compute the least-squares line for predicting y from x. Make a plot of residuals versus
fitted values.
a.
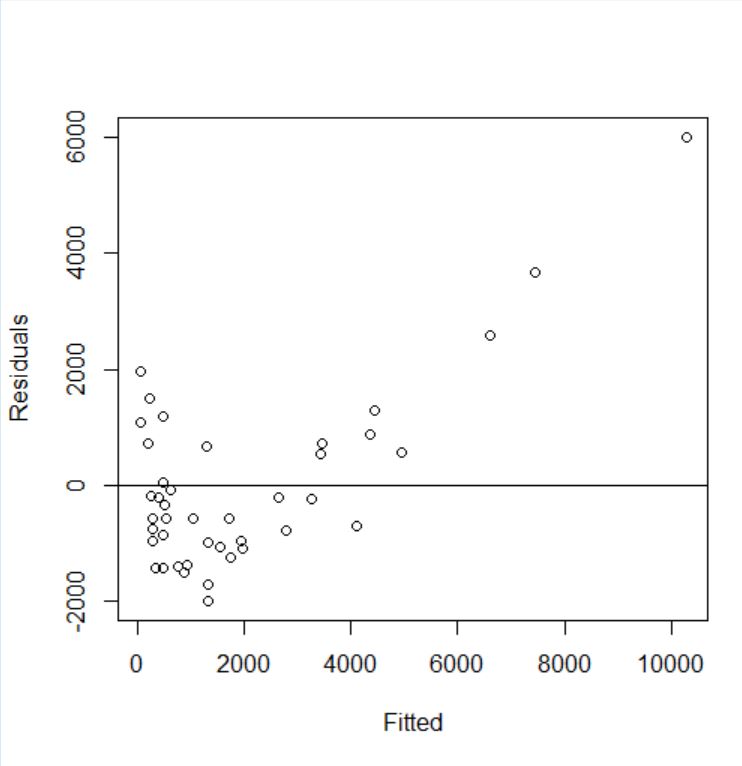
b. Compute the least-squares line for predicting y from In x. Make a plot of residuals
versus fitted values.
Compute the least-squares line for predicting In y from In x. Make a plot of residuals
versus fitted values.
C.
d.
Which of the three models (a) through (c) fits best? Explain.
Using the best model, predict the peak flow when the discharge is 50.0 km?lyr.
e.
f.
Using the best model, find a 95% prediction interval for the peak flow when the
discharge is 50.0 kmlyr.

Transcribed Image Text:The article "Characteristics and Trends of River Discharge into Hudson, James, and Ungava
Bays, 1964-2000" (S. Dery, M. Stieglitz, et al., Journal of Climate, 2005:2540-2557)
presents measurements of discharge rate x (in kmlyr) andpeakflow y (in m/s) for 42 rivers
that drain into the Hudson, James, and Ungava Bays. The data are shown in the following
table:
Discharge
Peak Flow
94.24
4110.3
66.57
4961.7
59.79
10275.5
48.52
6616.9
40.00
7459.5
32.30
2784.4
31.20
3266.7
30.69
4368.7
26.65
1328.5
22.75
4437.6
21.20
1983.0
20.57
1320.1
19.77
1735.7
18.62
1944.1
17.96
3420.2
17.84
2655.3
16.06
3470.3
1561.6
14.69
11.63
869.8
11.19
936.8
11.08
1315.7
10.92
1727.1
9.94
768.1
7.86
483.3
Expert Solution
Step 1
For estimating the regression equation using least squares, we will use R to find for the regression equation:-
The command which is used is lm(y~x).
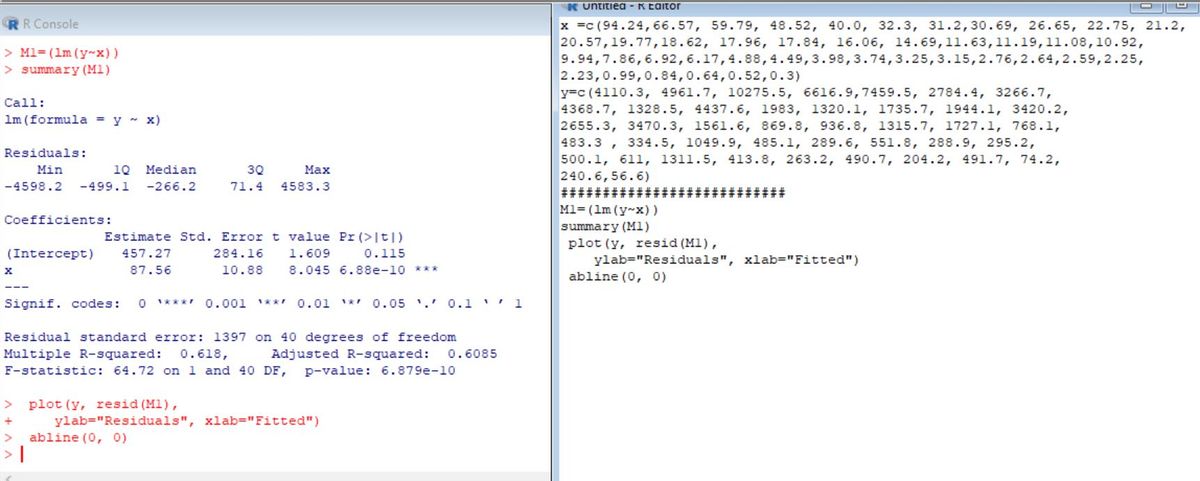
Y = 457.27 + 87.56 X
Step 2
B) It is also solved in R using the same command in (A).
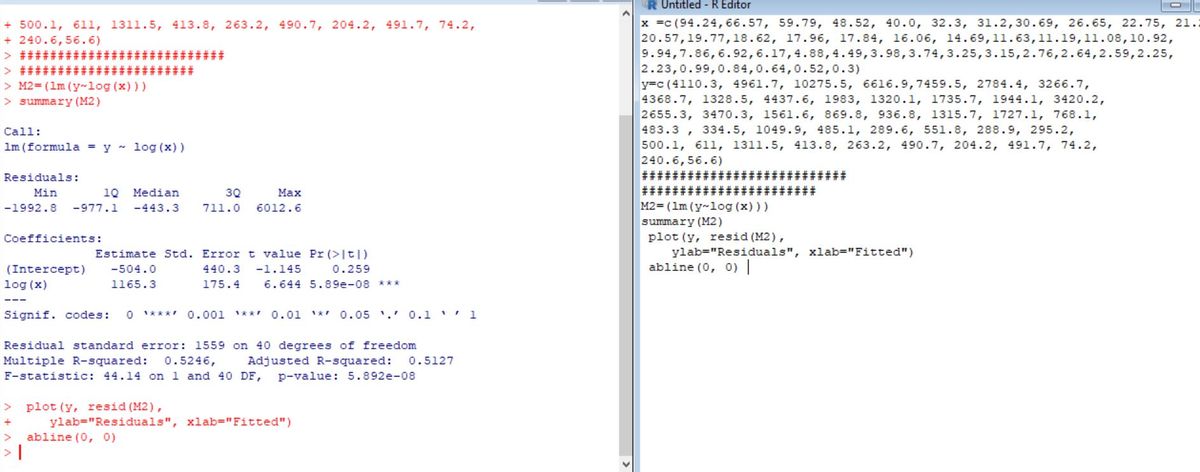
The regression equation will be
Y = 1165.3 log(X) -504

Step by step
Solved in 3 steps with 6 images

Recommended textbooks for you
Glencoe Algebra 1, Student Edition, 9780079039897…
Algebra
ISBN:
9780079039897
Author:
Carter
Publisher:
McGraw Hill

Big Ideas Math A Bridge To Success Algebra 1: Stu…
Algebra
ISBN:
9781680331141
Author:
HOUGHTON MIFFLIN HARCOURT
Publisher:
Houghton Mifflin Harcourt
Glencoe Algebra 1, Student Edition, 9780079039897…
Algebra
ISBN:
9780079039897
Author:
Carter
Publisher:
McGraw Hill
Big Ideas Math A Bridge To Success Algebra 1: Stu…
Algebra
ISBN:
9781680331141
Author:
HOUGHTON MIFFLIN HARCOURT
Publisher:
Houghton Mifflin Harcourt