TABLE 5.26 Mileage Chart for Problem 5-8 Distribution area 1 2 نیا 3 Refinery 1 Refinery 2 300 180 180 800 900 Refinery 3 220 200 120

Q: Explain how each part of diagram(a) corresponds to each part of diagram(b).
A: Each part of the binary tree in image (a) corresponds to the array in image (b):Root (16):…
Q: Based on the two tables and the attributes below, write SQL commands for each question to retrieve…
A: In this question we have to write a SQL command based on the tables provided in the question. Let's…
Q: Given two strings A and B and the following operations can be performed on A. Find a minimum number…
A: The objective of the question is to design a dynamic programming algorithm to find the minimum…
Q: which category does the data driven question best fit into: What are the favorite food items of the…
A: The objective of the question is to determine the category of data analysis that best fits the…
Q: BDAN 250 The variable Meta_score is: continuous categorical…
A: categoricalExplanation:The Meta score is basically a review score given to films, shows, etc. It is…
Q: Suppose your computer's CPU limits the time to one minute to process the instance of the problem…
A: The image contains a text-based problem related to computer science and algorithm time complexity.…
Q: For this question you will perform two levels of quicksort on an array containing these numbers: 59…
A: Quicksort can be defined in such a way that it is a basically a sorting algorithm that is used in…
Q: Pacific Developers Inc., in Surrey, B.C., is considering purchasing a water park for $1,850,000. Top…
A: The objective of the question is to calculate the Net Present Value (NPV) of the investment…
Q: The following question is a data driven question: "What drink is the customer likely to purchase…
A: The objective of the question is to categorize a data-driven question: "What drink is the customer…
Q: Problem 1: Let A = [a1, a2, . . . , an] be an array of different integers and suppose thatthere…
A: The objective of the question is to find an index 'k' in an array 'A' such that the subarray [a1,…
Q: Which of the following is true about the char_arr variable? char char_arr[] = "Let Us C++!";…
A: The given code declares and initializes a character array (char_arr) with the string "Let Us C++!".…
Q: quarter is worth 25 cents, a nickel is worth 5 cents, and a penny is worth 1 cent. Write a Java…
A: Java is a high-level, cross-platform, object-oriented programming language created by Sun…
Q: 5) Now let's move on to Heaps... Given a max heap implementation, draw the heap after each of the…
A: A max heap is a binary tree data structure where the value of each node is greater than or equal to…
Q: How to represent the following graph using both an adjacent list and an adjacent matrix
A: In this question we have to understand the representation of the graph using both an adjacent list…
Q: Instructions Solve for the following problems numerically using Manual solutions and using Python…
A: To prove the trigonometric equality sin2(θ)=(1−cos(2θ))/2, I employed Euler's identities manually.…
Q: You are given a graph with five vertices (1,2,3,4,5). You are also told that the DFS sequence is…
A: A graph traversal algorithm called Depth-First Search, or DFS, travels as far as feasible down each…
Q: QuickSort is run for an array A in a manner that PARTITION consistently produces a 5:1 split for the…
A: The objective of the question is to determine the length of the longest path from the root to a leaf…
Q: Consider the set of items S= {a, b, c, d, e, f, g, h}, where the items have the following (benefit,…
A: The process is to maximize the total benefit within a maximum weight constraint by choosing items…
Q: 1. BFS (Breadth First Search) and DFS (Depth First Search) algorithms on graphs. a. Represent the…
A: Algorithm for Breadth First Search (BFS) :1. Create a queue and enqueue the source node.2. Create a…
Q: Sensitivity analysis in linear programming problem is best described as: O An analysis to ensure an…
A: In this question we have to answer which statement describe Sensitivity analysis in linear…
Q: Maximize the given objective function using a genetic algorithm f(x)=x³ where x € (0.22)
A: A generic algorithm, also known as a genetic algorithm, is a heuristic optimization technique…
Q: Subject: Design analysis of algorithm
A: The objective of the question is to explain the algorithm for finding the length of the Longest…
Q: 9. How does the insertion sort algorithm differ in efficiency compared to the quicksort algorithm…
A: Insertion sort and quicksort are two separate sorting algorithms that differ in their efficiency and…
Q: Let M be the following Turing machine: ● Input alphabet: Σ = {0,1} = {0, 1,0} Tape alphabet: I = Set…
A: Turing machine is a computational model which is like a finite automata that can read, write and…
Q: Find the complexity of the traditional algorithms as Big O notation: - Find the average of the array…
A: Time complexity is a metric used to assess an algorithm's effectiveness based on how long it takes…
Q: BDAN 250 Select the answer that best describes an ordinal variable: A categorical…
A: A categorical variable where there is a logical rank-order relationship between the variable…
Q: Given two strings A and B and the following operations can be performed on A. Find a minimum number…
A: The objective of the question is to design a dynamic programming algorithm to find the minimum…
Q: A bank wants to reject erroneous account numbers to avoid invalid input. Management of the bank was…
A: In the given scenario, the technique that best matches it is explained below in detail.
Q: 3. Perform Alpha-Beta pruning on the minimax tree below. + 2 -4 -1 3 0 UN 1-2 3 NO OT 3 -2 -1
A: In the following figures, we have constructed the tree and assign each level MAX and MIN position…
Q: Transform the description into linear programming constraints: Example: One and only one action of x…
A: To transform the given descriptions into linear programming constraints, let's use the following…
Q: For my Insert and Remove Method for a BInaryTree how can I replicate it for the AVL Insert and…
A: The code that is provided implements a Binary Tree for string data and attempts to extend its…
Q: llustrate that the nodes of any AVL tree T can be colored “red” and “black” so that T becomes a…
A: The AVL tree can be defined in such a way that it is a self-balancing binary search tree, and the…
Q: la. Find the complexity of the algorithm as Big O notation: countValue(a, n, val) { } count = 0 for…
A: Time complexity gauges how the execution time of an algorithm scales with input size. It provides a…
Q: Determine the constraint matrix for the directed network shown: 1 2 3 4
A: In network theory, directed networks are often represented by graphs where edges have a defined…
Q: 3. Single source shortest paths algorithms. Apply Dijkstra's algorithm to find shortest paths in the…
A: Dijkstra's Algorithm works on the basis that any subpath B-> D of the shortest path A->D…
Q: True or False: Data Analysis resources should focus on high-risk transactions to increase assurance…
A: The answer is: TrueIn data analysis, it is crucial to concentrate on high-risk transactions for many…
Q: 6. T(n) = 5T(n/2) + n²
A: Big O is a mathematical notation that describes the upper bound on growth rate of time complexity in…
Q: Which states are in the set Δ^({0,1,2,3},aba) (i.e., which states are reachable from states…
A: Finite automata are used in theoretical computer science and automata theory to recognize string…
Q: Show the state of the index after each operation: a) Insertion of entry 1 b) Insertion of entry 23…
A: Extendible Hashing is a dynamic hashing technique designed to efficiently manage large databases by…
Q: Design a recursive version of dynamic programming algorithm (Top-down) to construct the actual…
A: The objective of the question is to design a top-down dynamic programming algorithm to solve the…
Q: Suppose we need to write an efficient program to store N employee records for ABC Inc where each…
A: This inquiry examines how effectively various data structures store and retrieve employee records…
Q: Consider the two algorithms: Algorithm A, whose time complexity is O(n²) and Algorithm B, whose time…
A: A measure known as time complexity indicates how long an algorithm takes to execute in relation to…
Q: To select records from a table for whose first names are neither Jerry nor Cosmo, which of the…
A: A statement or command written in SQL, a domain-specific language intended for managing and…
Q: dn1-EN (3).pdf (i) What is the time complexity of the function FooBar in terms of n? Justify your…
A: Below are the explanation answers for above three questions
Q: Which of the following statements is false? The code that performs a task in response to an event is…
A: Effective application development in the JavaFX domain requires a grasp of the differences between…
Q: 2. Minimum Spanning Tree (MST) algorithms. 10 8 9 B 2 9 12 5 E D 6 4 a. Apply Kruskal's algorithm to…
A: Minimum spanning tree is a subset of the edges of a connected and edge weighted graph that connects…
Q: 2. Minimum Spanning Tree (MST) algorithms. 10 8 2 9 B 12 5 E 6 4 a. Apply Kruskal's algorithm to the…
A: In a weighted graph, Dijkstra's algorithm is a greedy graph traversal technique that finds the…
Q: Please develop a well-documented pseudocode that generates all possible subsets of a given set T…
A: The given pseudocode aims to generate the power set of the elements in the dataSet stack using a…
Q: O Chain O Basic O Datum O Reference dimensioning will result in tolerance accumulation.
A: In this question we have to understand about - _______ dimensioning will result in tolerance…
Q: Make a UML diagram, Entity Relationship Model with the following data from the table: Entity Key…
A: To make an ER diagram, rectangle refers entities, oval refers attributes, diamond refers…
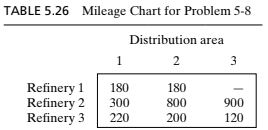
Three refineries with daily capacities of 6, 5, and 8 million gallons, respectively, supply
three distribution areas with daily demands of 4, 8, and 7 million gallons, respectively.
Gasoline is transported to the three distribution areas through a network of pipelines.
The transportation cost is 10 cents per 1000 gallons per pipeline mile. Table 5.26 gives the
mileage between the refineries and the distribution areas. Refinery 1 is not connected to
distribution area 3.
show Lp formulation and
(a) Construct the associated transportation model.
(b) Determine the optimum shipping schedule in the network.

Step by step
Solved in 1 steps with 1 images
