
MATLAB: An Introduction with Applications
6th Edition
ISBN: 9781119256830
Author: Amos Gilat
Publisher: John Wiley & Sons Inc
expand_more
expand_more
format_list_bulleted
Related questions
Topic Video
Question
D, E, F
detailed calculations and explanations please.
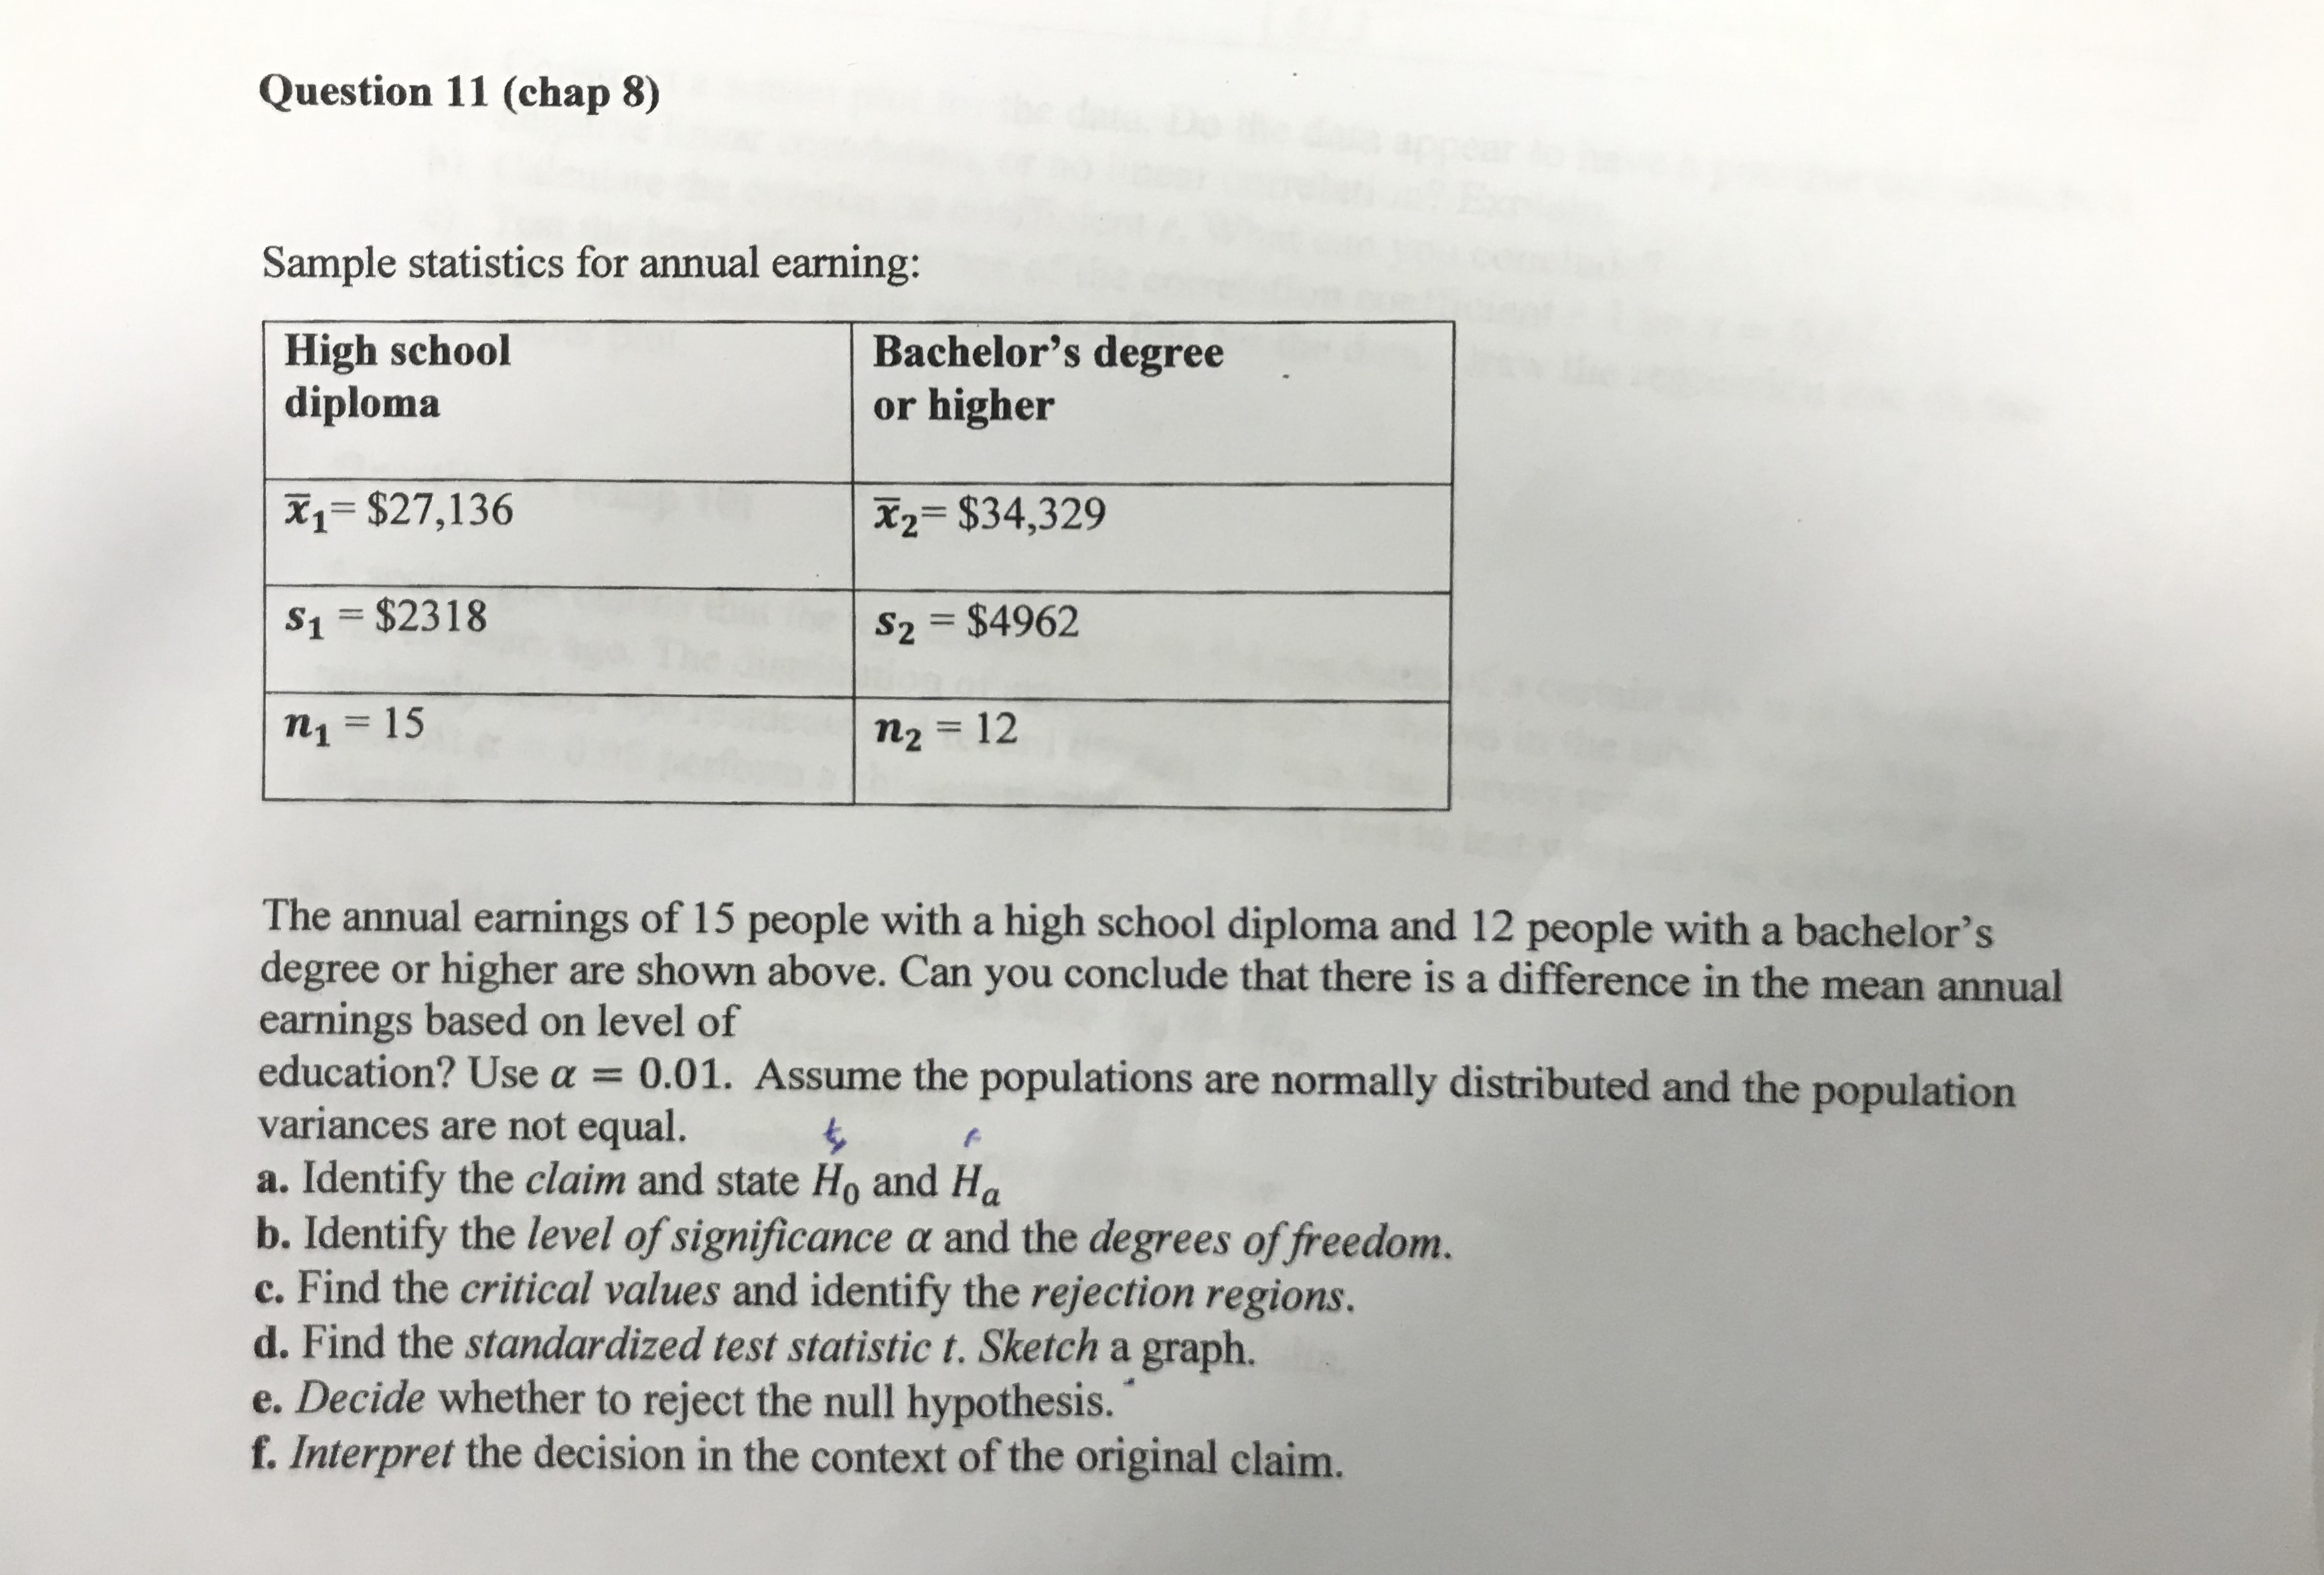

Transcribed Image Text:Sample statistics for annual earning:
High school
diploma
Bachelor's degree
or higher
X1= $27,136
X2= $34,329
%3D
S1 = $2318
S2 = $4962
%3D
n1 = 15
%3D
n2 = 12
%3D
The annual earnings of 15 people with a high school diploma and 12 people with a bachelor's
degree or higher are shown above. Can you conclude that there is a difference in the mean annual
earnings based on level of
education? Use a = 0.01. Assume the populations are normally distributed and the population
variances are not equal.
a. Identify the claim and state Ho and Ha
b. Identify the level of significance a and the degrees of freedom.
c. Find the critical values and identify the rejection regions.
d. Find the standardized test statistic t. Sketch a graph.
e. Decide whether to reject the null hypothesis.
f. Interpret the decision in the context of the original claim.
Expert Solution
This question has been solved!
Explore an expertly crafted, step-by-step solution for a thorough understanding of key concepts.

Step by stepSolved in 2 steps with 6 images

Knowledge Booster


Learn more about
Need a deep-dive on the concept behind this application? Look no further. Learn more about this topic, statistics and related others by exploring similar questions and additional content below.Similar questions
- 11.1X.02 A circle centered at (-3,7) passes through the point (1,2). Write the equation of this circle.arrow_forwardClassify the parallelogram. Explain your reasoningarrow_forwardPlease answer with a neat presentation, so that it's easy to read. Also, if you can show your work so that I can see how to do the current and future problems like this. Thank you.arrow_forward
- Describe all points that are 3 units away from the x-axis. What geometric structure do these points create?arrow_forward(SUB-PART C ONLY PLEASE) Each row represents an experimental “run” (in this case, averaged sample of mango wine). Column A shows the run number; Column B shows the percentage of ethanol; Column C shows the amount of glycerol (in g/L); Column D shows the amount of acid (in g/L); Column E shows the temperature of the run (in °C); and Column F shows the pH of the run. Y represents Ethanol of mango wine. 1. Create a scatterplot of the ethanol data for all 20 runs (CREATED) a. Draw a graphical representation of the model that you chose to use. (CREATED WITHIN SCATTERPLOT) b. Comparing the model to your data, evaluate its fit in one or two sentences. (LINEAR MODEL; The conditions to say that the model is a good fit are as given below: To say that the model is the good fit, the coefficient of determination should be high. Atleast one the predictor variables should be statistically significant in predicting the response variable. ) c. Replace the generic Yi = β0 + ε with the information you…arrow_forwardEnter segments in the blanks provided that would result in a true equation. I F H. E FG Submit Answer EF Privacy Policy Terms of Service tv 18 MacBook Air 888 こニ。 DII 80 FB F5 F6 F7 F3 F1 F2 23 $ % & 3 4 7 8. 1 Q W E Y A S D F C V つ つ エarrow_forward
arrow_back_ios
arrow_forward_ios
Recommended textbooks for you
- MATLAB: An Introduction with ApplicationsStatisticsISBN:9781119256830Author:Amos GilatPublisher:John Wiley & Sons Inc
 Probability and Statistics for Engineering and th...StatisticsISBN:9781305251809Author:Jay L. DevorePublisher:Cengage Learning
 Statistics for The Behavioral Sciences (MindTap C...StatisticsISBN:9781305504912Author:Frederick J Gravetter, Larry B. WallnauPublisher:Cengage Learning
  Elementary Statistics: Picturing the World (7th E...StatisticsISBN:9780134683416Author:Ron Larson, Betsy FarberPublisher:PEARSON
 The Basic Practice of StatisticsStatisticsISBN:9781319042578Author:David S. Moore, William I. Notz, Michael A. FlignerPublisher:W. H. Freeman
 Introduction to the Practice of StatisticsStatisticsISBN:9781319013387Author:David S. Moore, George P. McCabe, Bruce A. CraigPublisher:W. H. Freeman
MATLAB: An Introduction with Applications
Statistics
ISBN:9781119256830
Author:Amos Gilat
Publisher:John Wiley & Sons Inc
Probability and Statistics for Engineering and th...
Statistics
ISBN:9781305251809
Author:Jay L. Devore
Publisher:Cengage Learning
Statistics for The Behavioral Sciences (MindTap C...
Statistics
ISBN:9781305504912
Author:Frederick J Gravetter, Larry B. Wallnau
Publisher:Cengage Learning
Elementary Statistics: Picturing the World (7th E...
Statistics
ISBN:9780134683416
Author:Ron Larson, Betsy Farber
Publisher:PEARSON
The Basic Practice of Statistics
Statistics
ISBN:9781319042578
Author:David S. Moore, William I. Notz, Michael A. Fligner
Publisher:W. H. Freeman
Introduction to the Practice of Statistics
Statistics
ISBN:9781319013387
Author:David S. Moore, George P. McCabe, Bruce A. Craig
Publisher:W. H. Freeman