Question 1. How does the relationship between carbon dioxide and temperature in the ice core data (Fig. 4) compare to your graph (Fig. 3 or spreadsheet plot)? Explain
Question 1. How does the relationship between carbon dioxide and temperature in the ice core data (Fig. 4) compare to your graph (Fig. 3 or spreadsheet plot)? Explain

Applications and Investigations in Earth Science (9th Edition)
9th Edition
ISBN:9780134746241
Author:Edward J. Tarbuck, Frederick K. Lutgens, Dennis G. Tasa
Publisher:Edward J. Tarbuck, Frederick K. Lutgens, Dennis G. Tasa
Chapter1: The Study Of Minerals
Section: Chapter Questions
Problem 1LR

Related questions
Question
what is the relationship between temperature and atmospheric Cax shown in the ice core data in Figure
4?
Transcribed Image Text:-12
wwwww
400000
Age (years before present)
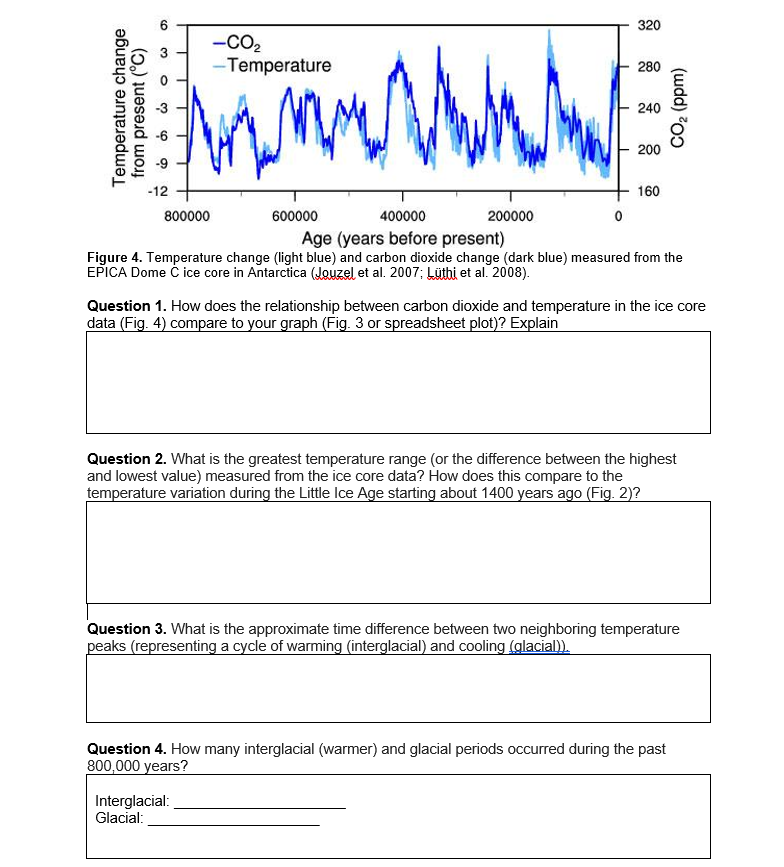
Figure 4. Temperature change (light blue) and carbon dioxide change (dark blue) measured from the
EPICA Dome C ice core in Antarctica (Jouzel et al. 2007; Lüthi et al. 2008).
800000
-CO₂
-Temperature
600000
200000
Interglacial:
Glacial:
320
0
280
240
200
160
Question 1. How does the relationship between carbon dioxide and temperature in the ice core
data (Fig. 4) compare to your graph (Fig. 3 or spreadsheet plot)? Explain
CO₂ (ppm)
Question 2. What is the greatest temperature range (or the difference between the highest
and lowest value) measured from the ice core data? How does this compare to the
temperature variation during the Little Ice Age starting about 1400 years ago (Fig. 2)?
Question 3. What is the approximate time difference between two neighboring temperature
peaks (representing a cycle of warming (interglacial) and cooling (glacial)).
Question 4. How many interglacial (warmer) and glacial periods occurred during the past
800,000 years?
Expert Solution
This question has been solved!
Explore an expertly crafted, step-by-step solution for a thorough understanding of key concepts.

Step by step
Solved in 3 steps

Recommended textbooks for you
Applications and Investigations in Earth Science …
Earth Science
ISBN:
9780134746241
Author:
Edward J. Tarbuck, Frederick K. Lutgens, Dennis G. Tasa
Publisher:
PEARSON

Exercises for Weather & Climate (9th Edition)
Earth Science
ISBN:
9780134041360
Author:
Greg Carbone
Publisher:
PEARSON

Environmental Science
Earth Science
ISBN:
9781260153125
Author:
William P Cunningham Prof., Mary Ann Cunningham Professor
Publisher:
McGraw-Hill Education
Applications and Investigations in Earth Science …
Earth Science
ISBN:
9780134746241
Author:
Edward J. Tarbuck, Frederick K. Lutgens, Dennis G. Tasa
Publisher:
PEARSON
Exercises for Weather & Climate (9th Edition)
Earth Science
ISBN:
9780134041360
Author:
Greg Carbone
Publisher:
PEARSON
Environmental Science
Earth Science
ISBN:
9781260153125
Author:
William P Cunningham Prof., Mary Ann Cunningham Professor
Publisher:
McGraw-Hill Education

Earth Science (15th Edition)
Earth Science
ISBN:
9780134543536
Author:
Edward J. Tarbuck, Frederick K. Lutgens, Dennis G. Tasa
Publisher:
PEARSON

Environmental Science (MindTap Course List)
Earth Science
ISBN:
9781337569613
Author:
G. Tyler Miller, Scott Spoolman
Publisher:
Cengage Learning

Physical Geology
Earth Science
ISBN:
9781259916823
Author:
Plummer, Charles C., CARLSON, Diane H., Hammersley, Lisa
Publisher:
Mcgraw-hill Education,