
FINANCIAL ACCOUNTING
10th Edition
ISBN: 9781259964947
Author: Libby
Publisher: MCG
expand_more
expand_more
format_list_bulleted
Related questions
Question
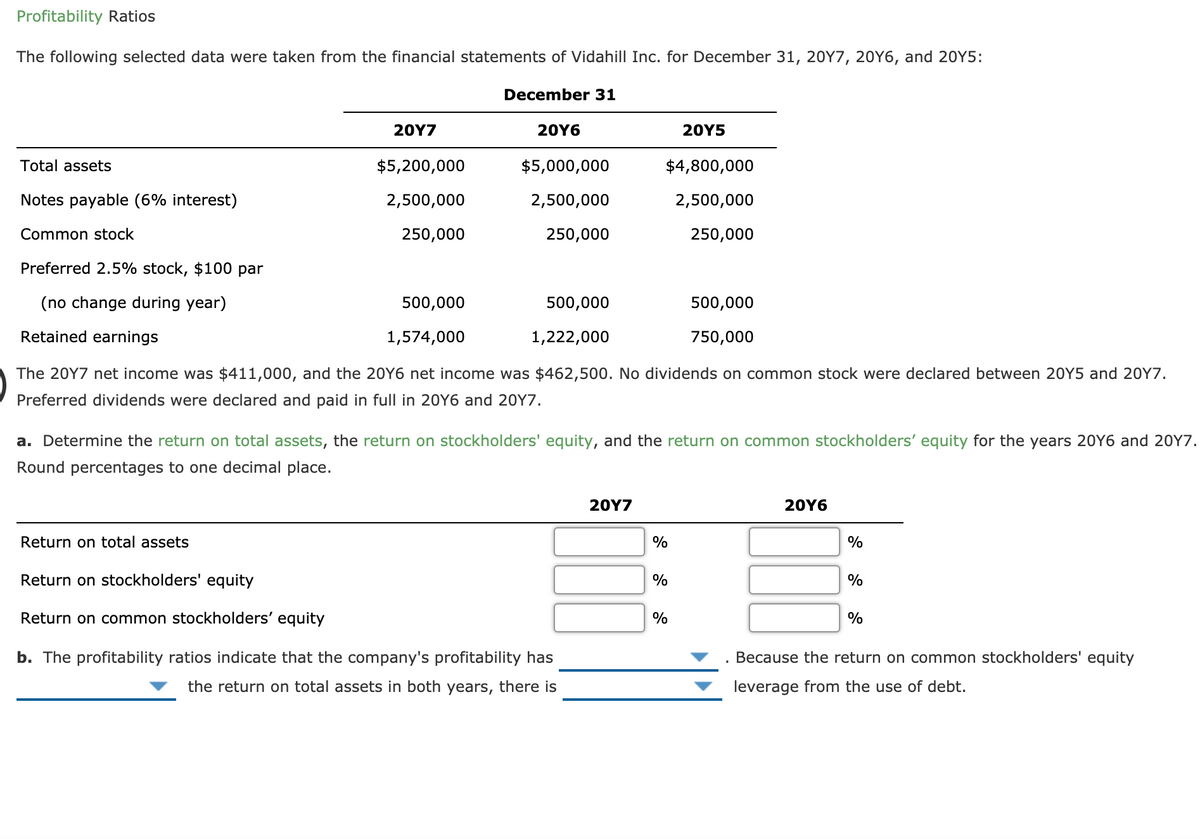

Transcribed Image Text:Profitability Ratios
The following selected data were taken from the financial statements of Vidahill Inc. for December 31, 20Y7, 20Y6, and 20Y5:
December 31
20Υ7
20Y6
20Y5
Total assets
$5,200,000
$5,000,000
$4,800,000
Notes payable (6% interest)
2,500,000
2,500,000
2,500,000
Common stock
250,000
250,000
250,000
Preferred 2.5% stock, $100 par
(no change during year)
500,000
500,000
500,000
Retained earnings
1,574,000
1,222,000
750,000
The 20Y7 net income was $411,000, and the 20Y6 net income was $462,500. No dividends on common stock were declared between 20Y5 and 20Y7.
Preferred dividends were declared and paid in full in 20Y6 and 20Y7.
a. Determine the return on total assets, the return on stockholders' equity, and the return on common stockholders' equity for the years 20Y6 and 20Y7.
Round percentages to one decimal place.
20Υ7
20Y6
Return on total assets
%
%
Return on stockholders' equity
%
Return on common stockholders' equity
%
%
b. The profitability ratios indicate that the company's profitability has
Because the return on common stockholders' equity
the return on total assets in both years, there is
leverage from the use of debt.
Expert Solution
This question has been solved!
Explore an expertly crafted, step-by-step solution for a thorough understanding of key concepts.

This is a popular solution

Trending nowThis is a popular solution!

Step by stepSolved in 5 steps

Knowledge Booster


Learn more about
Need a deep-dive on the concept behind this application? Look no further. Learn more about this topic, accounting and related others by exploring similar questions and additional content below.Similar questions
- Current Position Analysis The following data were taken from the balance sheet of Nilo Company at the end of two recent fiscal years: Current Year Previous Year Current assets: Cash $395,200 $324,000 Marketable securities 457,600 364,500 Accounts and notes receivable (net) 187,200 121,500 Inventories 617,800 411,800 Prepaid expenses 318,200 263,200 Total current assets $1,976,000 $1,485,000 Current liabilities: Accounts and notes payable (short-term) $301,600 $315,000 Accrued liabilities 218,400 135,000 Total current liabilities $520,000 $450,000 a. Determine for each year (1) the working capital, (2) the current ratio, and (3) the quick ratio. Round ratios to one decimal place. Current Year Previous Year 1. Working capital %24 2. Current ratio 3. Quick ratioarrow_forwardMeasures of liquidity, Solvency, and Profitability The comparative financial statements of Marshall Inc. are as follows. The market price of Marshall common stock was $ 67 on December 31, 20Y2. Marshall Inc. Comparative Retained Earnings Statement For the Years Ended December 31, 20Y2 and 20Y1 20Y2 20Υ1 Retained earnings, January 1 $3,595,450 $3,035,750 Net income 851,200 621,800 Dividends: On preferred stock On common stock (10,500) (10,500) (51,600) (51,600) Retained earnings, December 31 $4,384,550 $3,595,450 Marshall Inc. Comparative Income Statement For the Years Ended December 31, 20Y2 and 20Y1 20Υ2 20Υ1 Sales $4,847,930 $4,466,640 Cost of merchandise sold 1,594,320 1,466,770 Gross profit $3,253,610 $2,999,870 Selling expenses $1,112,980 $1,377,430 Administrative expenses 948,100 808,960 Total operating expenses $2,061,080 $2,186,39o Income from operations $1,192,530 $813,480 Other revenue and expense: Other revenue 62,770 51,920 Other expense (interest) (288,000) (158,400)…arrow_forwardProfitability Ratios The following selected data were taken from the financial statements of Vidahill Inc. for December 31, 20Y7, 20Y6, and 20Y5: December 31 20Y7 20Y6 20Y5 Total assets $250,000 $225,000 $200,000 Notes payable (8% interest) 80,000 80,000 80,000 Common stock 32,000 32,000 32,000 Preferred 7% stock, $100 par 16,000 16,000 16,000 (no change during year) Retained earnings 88,510 64,380 48,000 The 20Y7 net income was $25,250, and the 20Y6 net income was $17,500. No dividends on common stock were declared between 20Y5 and 20Y7. Preferred dividends were declared and paid in full in 20Y6 and 20Y7. a. Determine the return on total assets, the return on stockholders' equity, and the return on common stockholders’ equity for the years 20Y6 and 20Y7. When required, round to one decimal place. 20Y7 20Y6 Return on total assets fill in the blank 1 % fill in the blank 2 % Return on stockholders’ equity fill…arrow_forward
- Measures of liquidity, Solvency, and Profitability The comparative financial statements of Marshall Inc. are as follows. The market price of Marshall common stock was $ 65 on December 31, 20Y2. Marshall Inc. Comparative Retained Earnings Statement For the Years Ended December 31, 20Y2 and 20Y1 20Y2 20Y1 Retained earnings, January 1 $1,173,375 $995,425 Net income 259,200 203,900 Total $1,432,575 $1,199,325 Dividends: On preferred stock $8,400 $8,400 On common stock 17,550 17,550 Total dividends $25,950 $25,950 Retained earnings, December 31 $1,406,625 $1,173,375 Marshall Inc. Comparative Income Statement For the Years Ended December 31, 20Y2 and 20Y1 20Y2 20Y1 Sales $1,622,790 $1,495,130 Cost of goods sold 611,010 562,130 Gross profit $1,011,780 $933,000 Selling expenses $341,930 $416,290 Administrative expenses 291,280 244,490 Total operating…arrow_forwardCurrent Position Analysis The following data were taken from the balance sheet of Albertini Company at the end of two recent fiscal years: Current Year Previous Year Current assets: Cash $486,400 $392,000 Marketable securities 563,200 441,000 Accounts and notes receivable (net) 230,400 147,000 Inventories 792,000 469,700 Prepaid expenses 408,000 300,300 Total current assets $2,480,000 $1,750,000 Current liabilities: Accounts and notes payable (short-term) $464,000 $490,000 Accrued liabilities 336,000 210,000 Total current liabilities $800,000 $700,000 a. Determine for each year (1) the working capital, (2) the current ratio, and (3) the quick ratio. Round ratios to one decimal place. Current Year Previous Year 1. Working capital $fill in the blank 1 $fill in the blank 2 2. Current ratio fill in the blank 3 fill in the blank 4…arrow_forwardMeasures of liquidity, solvency, and profitability The comparative financial statements of Marshall Inc. are as follows. The market price of Marshall common stock was $82.60 on December 31, 20Y2. Marshall Inc.Comparative Retained Earnings StatementFor the Years Ended December 31, 20Y2 and 20Y1 Line Item Description 20Y2 20Y1 Retained earnings, January 1 $3,704,000 $3,264,000 Net income $600,000 $550,000 Dividends: On preferred stock (10,000) (10,000) On common stock (100,000) (100,000) Increase in retained earnings $490,000 $440,000 Retained earnings, December 31 $4,194,000 $3,704,000 Marshall Inc.Comparative Income StatementFor the Years Ended December 31, 20Y2 and 20Y1 Line Item Description 20Y2 20Y1 Sales $10,850,000 $10,000,000 Cost of goods sold (6,000,000) (5,450,000) Gross profit $4,850,000 $4,550,000 Selling expenses $(2,170,000) $(2,000,000) Administrative expenses (1,627,500) (1,500,000) Total…arrow_forward
- Measures of liquidity, Solvency, and Profitability The comparative financial statements of Marshall Inc. are as follows. The market price of Marshall common stock was $ 63 on December 31, 20Y2. Marshall Inc. Comparative Retained Earnings Statement For the Years Ended December 31, 20Y2 and 20Y1 20Y2 20Y1 Retained earnings, January 1 $1,022,050 $862,950 Net income 233,600 176,800 Total $1,255,650 $1,039,750 Dividends: On preferred stock $7,700 $7,700 On common stock 10,000 10,000 Total dividends $17,700 $17,700 Retained earnings, December 31 $1,237,950 $1,022,050 Marshall Inc. Comparative Income Statement For the Years Ended December 31, 20Y2 and 20Y1 20Y2 20Y1 Sales $1,470,220 $1,354,620 Cost of goods sold 571,590 525,860 Gross profit $898,630 $828,760 Selling expenses $291,610 $366,610 Administrative expenses 248,400 215,310 Total operating expenses…arrow_forwardSelected financial data for Wilmington Corporation is presented below. WILMINGTON CORPORATION Balance Sheet As of December 31 Year 7 Year 6 Current Assets Cash and cash equivalents $ 634,527 $ 335,597 Marketable securities 166,106 187,064 Accounts receivable (net) 284,226 318,010 Inventories 466,942 430,249 Prepaid expenses 60,906 28,060 Other current assets 83,053 85,029 Total Current Assets 1,695,760 1,384,009 Property, plant and equipment 1,384,217 625,421 Long-term investment 568,003 425,000 Total Assets $3,647,980 $2,434,430 Current Liabilities Short-term borrowings $ 306,376 $ 170,419 Current portion of long-term debt 155,000 168,000 Accounts payable 279,522 314,883 Accrued liabilities 301,024 183,681 Income taxes payable 107,509 196,802 Total Current Liabilities 1,149,431…arrow_forward
arrow_back_ios
arrow_forward_ios
Recommended textbooks for you
 AccountingAccountingISBN:9781337272094Author:WARREN, Carl S., Reeve, James M., Duchac, Jonathan E.Publisher:Cengage Learning,
 Accounting Information SystemsAccountingISBN:9781337619202Author:Hall, James A.Publisher:Cengage Learning,
 Horngren's Cost Accounting: A Managerial Emphasis...AccountingISBN:9780134475585Author:Srikant M. Datar, Madhav V. RajanPublisher:PEARSON
 Intermediate AccountingAccountingISBN:9781259722660Author:J. David Spiceland, Mark W. Nelson, Wayne M ThomasPublisher:McGraw-Hill Education
 Financial and Managerial AccountingAccountingISBN:9781259726705Author:John J Wild, Ken W. Shaw, Barbara Chiappetta Fundamental Accounting PrinciplesPublisher:McGraw-Hill Education
Accounting
Accounting
ISBN:9781337272094
Author:WARREN, Carl S., Reeve, James M., Duchac, Jonathan E.
Publisher:Cengage Learning,
Accounting Information Systems
Accounting
ISBN:9781337619202
Author:Hall, James A.
Publisher:Cengage Learning,
Horngren's Cost Accounting: A Managerial Emphasis...
Accounting
ISBN:9780134475585
Author:Srikant M. Datar, Madhav V. Rajan
Publisher:PEARSON
Intermediate Accounting
Accounting
ISBN:9781259722660
Author:J. David Spiceland, Mark W. Nelson, Wayne M Thomas
Publisher:McGraw-Hill Education
Financial and Managerial Accounting
Accounting
ISBN:9781259726705
Author:John J Wild, Ken W. Shaw, Barbara Chiappetta Fundamental Accounting Principles
Publisher:McGraw-Hill Education