
MATLAB: An Introduction with Applications
6th Edition
ISBN: 9781119256830
Author: Amos Gilat
Publisher: John Wiley & Sons Inc
expand_more
expand_more
format_list_bulleted
Related questions
Question
thumb_up100%
I really need help with this problem! Thank you very much!
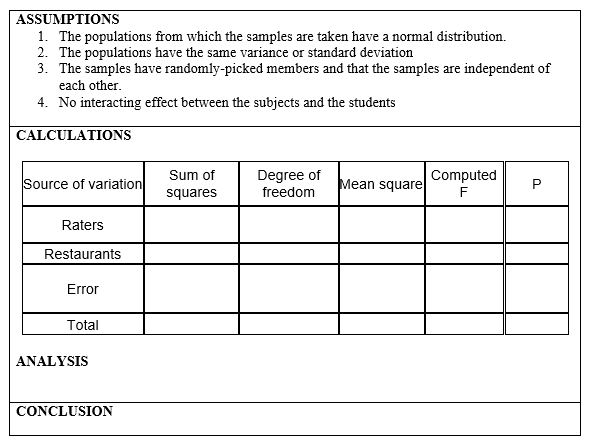

Transcribed Image Text:ASSUMPTIONS
1. The populations from which the samples are taken have a normal distribution.
2. The populations have the same variance or standard deviation
3. The samples have randomly-picked members and that the samples are independent of
each other.
4. No interacting effect between the subjects and the students
CALCULATIONS
Sum of
Degree of
freedom
Computed
Source of variation
Mean square
P
squares
Raters
Restaurants
Error
Total
ANALYSIS
CONCLUSION

Transcribed Image Text:PROBLEM STATEMENT 4
Suppose that a fast-food chain having four branches in a certain geographical area wants to
evaluate the service at these restaurants. The customer services director for the chain hires 24
investigators with varied experiences in food-service evaluations to act as raters. After
preliminary consultations, the 24 investigators are stratified into six blocks of four-based on food
service evaluation experience-so that the four most experienced investigators are placed in block
1, the next four most experienced investigators are placed in block 2, and so on.
Within each of the six homogenous blocks, the four raters are then randomly assigned to evaluate
the service at a particular restaurant using a rating scale from 0 (low) to 100 (high). The results
are summarized in the table shown below.
RESTAURANTS
BLOCKS OF
A.
B
RATERS
1
70
61
82
74
2
77
75
88
76
3
76
67
90
80
4
80
63
96
76
5
84
66
92
84
78
68
98
86
Use a 0.01 level of significance to test the hypothesis that
(a) service performance of the four restaurants are equal; (b) there is no significant differences
among the raters.
НYРОТHESIS
The rating of the investigators in the four restaurants are being compared in terms of two
factors:
Differences in the rating of the raters (investigators)
• Differences in the food-service performance of the restaurants
Thus, the hypotheses are:
Ho:
На:
Но:
На:
Test at a= 0.01
Critical Region: F; >
F1>
V2 =
v2 =
at vi =
at vi =
Expert Solution
This question has been solved!
Explore an expertly crafted, step-by-step solution for a thorough understanding of key concepts.

This is a popular solution

Trending nowThis is a popular solution!

Step by stepSolved in 4 steps with 1 images

Knowledge Booster

Similar questions
arrow_back_ios
arrow_forward_ios
Recommended textbooks for you
- MATLAB: An Introduction with ApplicationsStatisticsISBN:9781119256830Author:Amos GilatPublisher:John Wiley & Sons Inc
 Probability and Statistics for Engineering and th...StatisticsISBN:9781305251809Author:Jay L. DevorePublisher:Cengage Learning
 Statistics for The Behavioral Sciences (MindTap C...StatisticsISBN:9781305504912Author:Frederick J Gravetter, Larry B. WallnauPublisher:Cengage Learning
  Elementary Statistics: Picturing the World (7th E...StatisticsISBN:9780134683416Author:Ron Larson, Betsy FarberPublisher:PEARSON
 The Basic Practice of StatisticsStatisticsISBN:9781319042578Author:David S. Moore, William I. Notz, Michael A. FlignerPublisher:W. H. Freeman
 Introduction to the Practice of StatisticsStatisticsISBN:9781319013387Author:David S. Moore, George P. McCabe, Bruce A. CraigPublisher:W. H. Freeman
MATLAB: An Introduction with Applications
Statistics
ISBN:9781119256830
Author:Amos Gilat
Publisher:John Wiley & Sons Inc
Probability and Statistics for Engineering and th...
Statistics
ISBN:9781305251809
Author:Jay L. Devore
Publisher:Cengage Learning
Statistics for The Behavioral Sciences (MindTap C...
Statistics
ISBN:9781305504912
Author:Frederick J Gravetter, Larry B. Wallnau
Publisher:Cengage Learning
Elementary Statistics: Picturing the World (7th E...
Statistics
ISBN:9780134683416
Author:Ron Larson, Betsy Farber
Publisher:PEARSON
The Basic Practice of Statistics
Statistics
ISBN:9781319042578
Author:David S. Moore, William I. Notz, Michael A. Fligner
Publisher:W. H. Freeman
Introduction to the Practice of Statistics
Statistics
ISBN:9781319013387
Author:David S. Moore, George P. McCabe, Bruce A. Craig
Publisher:W. H. Freeman