
MATLAB: An Introduction with Applications
6th Edition
ISBN: 9781119256830
Author: Amos Gilat
Publisher: John Wiley & Sons Inc
expand_more
expand_more
format_list_bulleted
Related questions
Question
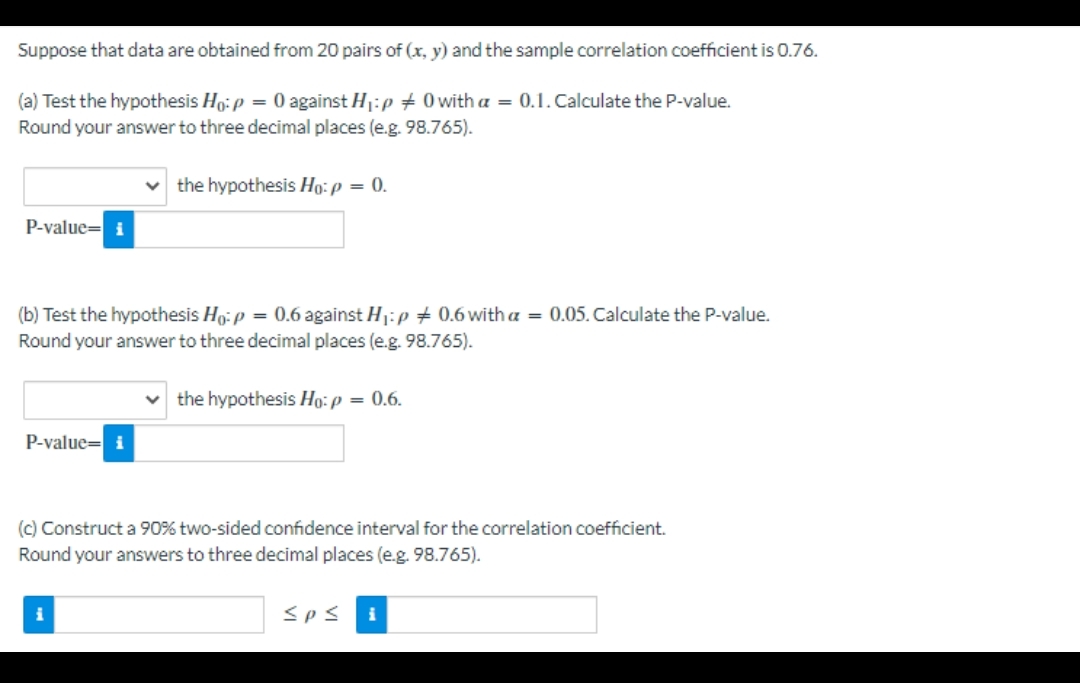

Transcribed Image Text:Suppose that data are obtained from 20 pairs of (x, y) and the sample correlation coefficient is 0.76.
(a) Test the hypothesis Ho:p = 0 against H:p + 0 with a = 0.1.Calculate the P-value.
Round your answer to three decimal places (e.g. 98.765).
the hypothesis Ho: p = 0.
P-value= i
(b) Test the hypothesis Ho: p = 0.6 against H:p + 0.6 with a = 0.05. Calculate the P-value.
Round your answer to three decimal places (e.g. 98.765).
the hypothesis Ho: p = 0.6.
P-value= i
(c) Construct a 90% two-sided confidence interval for the correlation coefficient.
Round your answers to three decimal places (e.g. 98.765).
i
Expert Solution
This question has been solved!
Explore an expertly crafted, step-by-step solution for a thorough understanding of key concepts.

Step by stepSolved in 3 steps with 3 images

Knowledge Booster

Similar questions
- use statcrunch to solve or explain how to solve on statcrunch (step)arrow_forwardWhat is the test statistic?(round to two decimal places) What is the pvalue?(round to three decimal places) Reject or don’t reject null hypothesis?arrow_forwardA data set contains information on the grams of fat and number of calories in 24 different fast foods. The correlation coefficient between fat content and calories is determined to be -0.63. Calculate the p-value for the test of significance.arrow_forward
- If the coefficient of determination is 0.5625 then calculate the correlation coeffcienarrow_forwardSeveral bakeries in a town were asked the price for different amounts of donuts at their shop. The scatter plot with Total Cost (in dollars) 876543 ~ TO 0 0 1 Donut Pricing 2 3 4 5 Number of Donuts 6 7 8 line of best fit was created from the data gathered. Part A: Estimate the correlation coefficient. Explain your reasoning for the given value. Part B: How many positive and negative residuals are there? Explain your reasoning. Part C: State the point with the largest absolute value residual and interpret the point in terms of the context of the data.arrow_forwardThe professor of an introductory statistics course has found something interesting: there is a small correlation between scores on his first midterm and the number of years the test-takers have spent at the university. For the 55 students taking the course, the professor found that the two variables number of years Espa spent by the student at the university and score on the first midterm have a sample correlation coefficient r of about -0.36. Test for a significant linear relationship between the two variables by doing a hypothesis test regarding the population correlation coefficient p. (Assume that the two variables have a bivariate normal distribution.) Use the 0.05 level of significance, and perform a two-tailed test. Then complete the parts below. (If necessary, consult a list of formulas.) (a) State the null hypothesis H and the alternative hypothesis H . Aa 0, B H, :0 H : O=0 (b) Determine the type of test statistic to use. (Choose one) ▼ Oarrow_forwardIf the correlation coefficient r is equal to 0.585, find the coefficient if determination and the coefficient of no determinationarrow_forwardFifty-four wild bears were anesthetized, and then their weights and chest sizes were measured and listed in a data set. Results are shown in the accompanying display. Is there sufficient evidence to support Correlation Results the claim that there is a linear correlation between the weights of bears and their chest sizes? When measuring an anesthetized bear, is it easier to measure chest size than weight? If so, does it appear that Correlation coeff, r: 0.959614 a measured chest size can be used to predict the weight? Use a significance level of = 0.05. Critical r: +0.2680855 P-value (two tailed): 0.000 Но: Р H1:P (Type integers or decimals. Do not round.) Identify the correlation coefficient, r. (Round to three decimal places as needed.) Identify the critical value(s). (Round to three decimal places as needed.) O A. There is one critical value at r= . B. There are two critical values at r= ± Is there sufficient evidence to support the claim that there is a linear correlation between…arrow_forwardplease complete the blank problem and or ones with a red x next to it not ones with a green check next to pleasearrow_forwardarrow_back_iosarrow_forward_ios
Recommended textbooks for you
- MATLAB: An Introduction with ApplicationsStatisticsISBN:9781119256830Author:Amos GilatPublisher:John Wiley & Sons Inc
 Probability and Statistics for Engineering and th...StatisticsISBN:9781305251809Author:Jay L. DevorePublisher:Cengage Learning
 Statistics for The Behavioral Sciences (MindTap C...StatisticsISBN:9781305504912Author:Frederick J Gravetter, Larry B. WallnauPublisher:Cengage Learning
  Elementary Statistics: Picturing the World (7th E...StatisticsISBN:9780134683416Author:Ron Larson, Betsy FarberPublisher:PEARSON
 The Basic Practice of StatisticsStatisticsISBN:9781319042578Author:David S. Moore, William I. Notz, Michael A. FlignerPublisher:W. H. Freeman
 Introduction to the Practice of StatisticsStatisticsISBN:9781319013387Author:David S. Moore, George P. McCabe, Bruce A. CraigPublisher:W. H. Freeman
MATLAB: An Introduction with Applications
Statistics
ISBN:9781119256830
Author:Amos Gilat
Publisher:John Wiley & Sons Inc
Probability and Statistics for Engineering and th...
Statistics
ISBN:9781305251809
Author:Jay L. Devore
Publisher:Cengage Learning
Statistics for The Behavioral Sciences (MindTap C...
Statistics
ISBN:9781305504912
Author:Frederick J Gravetter, Larry B. Wallnau
Publisher:Cengage Learning
Elementary Statistics: Picturing the World (7th E...
Statistics
ISBN:9780134683416
Author:Ron Larson, Betsy Farber
Publisher:PEARSON
The Basic Practice of Statistics
Statistics
ISBN:9781319042578
Author:David S. Moore, William I. Notz, Michael A. Fligner
Publisher:W. H. Freeman
Introduction to the Practice of Statistics
Statistics
ISBN:9781319013387
Author:David S. Moore, George P. McCabe, Bruce A. Craig
Publisher:W. H. Freeman