Part of an R output relating X (independent variable) and Y (dependent variable) is shown below. This analysis is based on 11 observations. Using what you know about how all of these values are related, fill in the remaining blanks. Round your answers to 4 decimals in Model Summary box. Round your answers to 2 decimals in the ANOVA table and beyond. Model Summary (4 decimal places each) RMSE R R-Squared Adj. R-Squared Pred. R-Squared Source Regression Residual ANOVA (2 decimal places each, where necessary) Sum of Squares Total X 0.515 Model (Intercept) 0.3632 1000 Parameter Estimates (2 decimal places each) Coef. Var. Beta df 5.7871 29.48 Std. Error Std. Beta 0.699 Mean Square -0.72 t F Sig. 3.79 0.0043 -3.091 0.0129 Sig 0.0129
Part of an R output relating X (independent variable) and Y (dependent variable) is shown below. This analysis is based on 11 observations. Using what you know about how all of these values are related, fill in the remaining blanks. Round your answers to 4 decimals in Model Summary box. Round your answers to 2 decimals in the ANOVA table and beyond. Model Summary (4 decimal places each) RMSE R R-Squared Adj. R-Squared Pred. R-Squared Source Regression Residual ANOVA (2 decimal places each, where necessary) Sum of Squares Total X 0.515 Model (Intercept) 0.3632 1000 Parameter Estimates (2 decimal places each) Coef. Var. Beta df 5.7871 29.48 Std. Error Std. Beta 0.699 Mean Square -0.72 t F Sig. 3.79 0.0043 -3.091 0.0129 Sig 0.0129

Glencoe Algebra 1, Student Edition, 9780079039897, 0079039898, 2018
18th Edition
ISBN:9780079039897
Author:Carter
Publisher:Carter
Chapter10: Statistics
Section10.3: Measures Of Spread
Problem 1GP

Related questions
Question
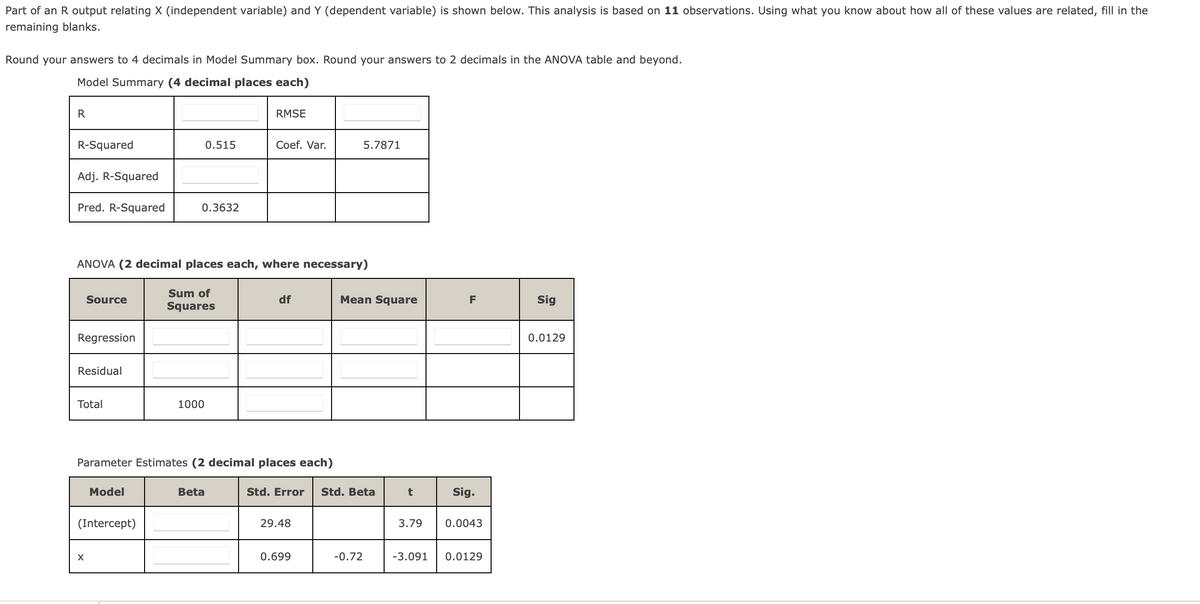
Transcribed Image Text:Part of an R output relating X (independent variable) and Y (dependent variable) is shown below. This analysis is based on 11 observations. Using what you know about how all of these values are related, fill in the
remaining blanks.
Round your answers to 4 decimals in Model Summary box. Round your answers to 2 decimals in the ANOVA table and beyond.
Model Summary (4 decimal places each)
R
R-Squared
Adj. R-Squared
Pred. R-Squared
Source
Regression
Residual
Total
ANOVA (2 decimal places each, where necessary)
Sum of
Squares
X
Model
(Intercept)
0.3632
0.515
1000
RMSE
Parameter Estimates (2 decimal places each)
Beta
Coef. Var.
df
29.48
5.7871
Std. Error Std. Beta
0.699
Mean Square
-0.72
t
F
Sig.
3.79 0.0043
-3.091 0.0129
Sig
0.0129
Expert Solution
This question has been solved!
Explore an expertly crafted, step-by-step solution for a thorough understanding of key concepts.

This is a popular solution!

Trending now
This is a popular solution!

Step by step
Solved in 8 steps with 31 images

Recommended textbooks for you
Glencoe Algebra 1, Student Edition, 9780079039897…
Algebra
ISBN:
9780079039897
Author:
Carter
Publisher:
McGraw Hill
Glencoe Algebra 1, Student Edition, 9780079039897…
Algebra
ISBN:
9780079039897
Author:
Carter
Publisher:
McGraw Hill