
MATLAB: An Introduction with Applications
6th Edition
ISBN: 9781119256830
Author: Amos Gilat
Publisher: John Wiley & Sons Inc
expand_more
expand_more
format_list_bulleted
Related questions
Question
One Line Two Lines
64.3 63.8
156.5 215.6
142.2 85.5
278.5 339.6
252.6 200.3
476.2 629.7
478.3 332.9
474.3 329.1
401.5 915.1
722.3 553.1
760.7 596.7
692.2 865.2
836.9 1090.2
903.4 663.2
733.8 517.8
605.7 566.1
267.9 268.1
309.8 349.8
128.8 95.2
132.8 100.1
122.3 163.4
128.8 100.9
232.8 ""
460.7 ""
481.8 ""
518.1 ""
509.1 ""
580.1 ""
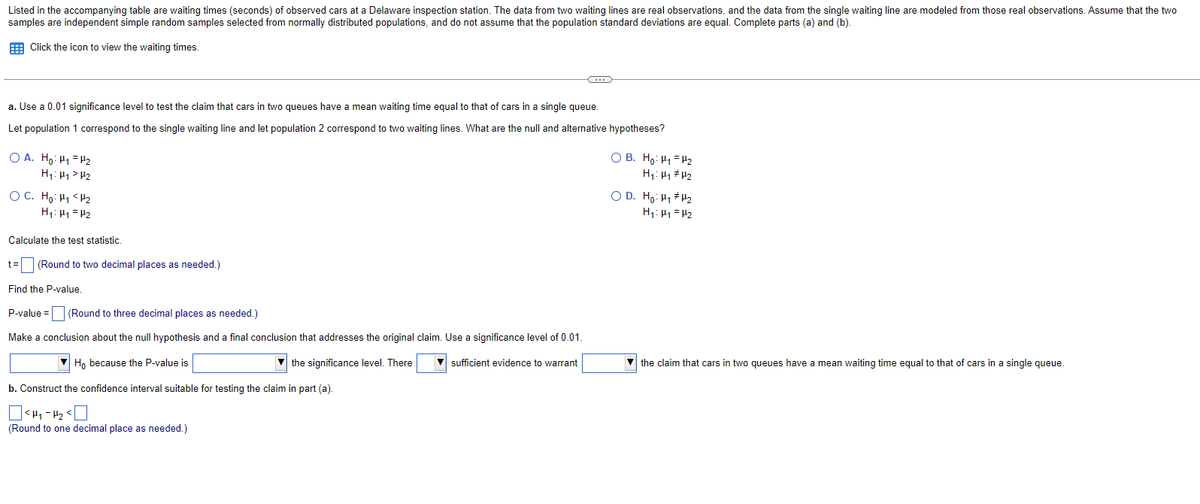

Transcribed Image Text:Listed in the accompanying table are waiting times (seconds) of observed cars at a Delaware inspection station. The data from two waiting lines are real observations, and the data from the single waiting line are modeled from those real observations. Assume that the two
samples are independent simple random samples selected from normally distributed populations, and do not assume that the population standard deviations are equal. Complete parts (a) and (b).
Click the icon to view the waiting times.
a. Use a 0.01 significance level to test the claim that cars in two queues have a mean waiting time equal to that of cars in a single queue.
Let population 1 correspond to the single waiting line and let population 2 correspond to two waiting lines. What are the null and alternative hypotheses?
OA. Ho: H₁ H₂
H₁: H₁ H₂
OC. Ho: H₁ <H₂
H₁: H₁ H₂
Calculate the test statistic.
t =
Find the P-value.
(Round to two decimal places as needed.)
P-value= (Round to three decimal places as needed.)
Make a conclusion about the null hypothesis and a final conclusion that addresses the original claim. Use a significance level of 0.01.
Ho because the P-value is
the significance level. There
▼sufficient evidence to warrant
b. Construct the confidence interval suitable for testing the claim in part (a).
<H₁-H₂<
(Round to one decimal place as needed.)
OB. Ho: H₁ H₂
H₁: H₁ H₂
OD. Hot #l
H₁:₁₂
the claim that cars in two queues have mean waiting time equal to that of cars in a single queue.
Expert Solution
This question has been solved!
Explore an expertly crafted, step-by-step solution for a thorough understanding of key concepts.

This is a popular solution

Trending nowThis is a popular solution!

Step by stepSolved in 3 steps with 1 images

Knowledge Booster

Similar questions
- Data: 46 81 73 59 50 6887 52 56 74 56 7291 54 90 72 85 7960 87 89 49 67 85Construct a stem-and-leaf plot. Be sure to include proper lengend (or key).arrow_forwarduda A web.kamihq.com/web/viewer.html?state%=%7B%22ids%22%3A%5B%221oBAMlekChkeNn7eQzagmhJvdC5dmK90Q%22%5 Apple iCloud Yahoo Bing Wikipedia Facebook Google Twitter Linkedin eltiempo.es Yelp TripAdvisor CKET 11/29/2021 13 2 EXIT TICKET.pdf NAME DATE PERIOD | SB LESSON 13-2 EXIT TICKET APQR is an isosceles triangle with vertex angle Q, PQ = 5x – 24, QR = 3x – 2, and PR = 5x – 8. Fill in the blanks to complete the sentence. The length of each leg of APQR is and the length of the base isarrow_forwardQuestion 9 < Find the 5 number summary for the data shown below. 86 37 9 29 83 40 52 33 48 46 5 number summary:arrow_forward
- Help.arrow_forwardApproximate the mean of the frequency distribution for the ages of the residents of a town. Age Frequency0-9 2810-19 3620-29 1830-39 2740-49 2050-59 5060-69 4270-79 1980-89 7arrow_forwardDetermine the equation of the best fit line shown below, and use this equation to predict the arm length of a person who is 75 inches tall.arrow_forward
- Calculate the five-number summary of the given data. Use the approximation method. Enter your answer in ascending order, separating each answer with a comma. 1, 19, 14, 3, 17, 21, 10, 12, 10, 16, 11,9, 22, 19,9 Answer Keypad Keyboard Shortcuts Tablesarrow_forwardHow do you Find the best predicted systolic blood pressure in the left arm given that the systolic blood pressure in the right arm is 100 mm HG. Identify the line of best fit?arrow_forwardMathematicS student.atitesting.com/OpenPage pps G Got Management Find the sum of 413.403, 4.12356, 4193.48, 95.631, 4.1284, and 786.47 A 54972.3596 B 5497.23606 5497.23596 D 5497.33596arrow_forward
- Please show solutionsarrow_forwardd-Whisker Plots HOTSPOT LABEL Find the range and interquartile range (IQR) for the monthly rainfall (in millime- ters) in Seattle based on the box-and-whisker plot below. Average Monthly Rainfall in Seattle (millimeters) in | bartleby - G... 20 80 140 +++ 200 . Press each hotspot. Label the corresponding number below with the requested value. All Charges Пarrow_forwardMiles (1000s) Price ($1000s) 116.53 25.6 100.27 22.2 29.93 43.3 25.47 27.6 49.96 36.2 83.68 29.8 62.53 24.3 85.54 32.8 27.93 35.0 89.31 23.6 59.89 25.5 17.87 23.6 20.35 29.2 116.65 24.7 63.18 25.0 30.54 37.8 51.36 19.6 34.83 46.2 93.06 27.1 116.49 17.7 68.08 22.5 29.90 26.6 39.98 25.6 98.06 22.2 44.43 26.0 22.90 39.9 52.13 32.3 57.72 21.8 67.89 23.6 61.77 36.4 46.90 24.6 57.89 21.4 94.41 21.4 50.73 22.2 41.88 22.5 110.06 27.0 22.25 40.2 57.00 26.7 15.73 26.8 99.87 22.9 98.30 30.2 90.12 15.3 31.55 32.5 30.47 30.6 33.28 36.0 52.94 18.1 17.60 29.6 88.29 38.4 90.98 23.8 75.39 25.0 28.20 22.3 102.03 30.3 28.38 31.4 45.44 36.3 44.82 37.2 74.81 26.3 33.22 40.9 29.30 29.1 17.73 35.9 53.33 31.7 31.54 44.5 30.83 43.4 51.38 41.0 53.26 32.2 15.61 32.3 101.39 24.6 77.04 26.8 86.47 20.5 119.18 19.3 35.96 33.6 99.38 27.1 103.17 33.2 37.72 25.4 75.59 21.2…arrow_forward
arrow_back_ios
SEE MORE QUESTIONS
arrow_forward_ios
Recommended textbooks for you
- MATLAB: An Introduction with ApplicationsStatisticsISBN:9781119256830Author:Amos GilatPublisher:John Wiley & Sons Inc
 Probability and Statistics for Engineering and th...StatisticsISBN:9781305251809Author:Jay L. DevorePublisher:Cengage Learning
 Statistics for The Behavioral Sciences (MindTap C...StatisticsISBN:9781305504912Author:Frederick J Gravetter, Larry B. WallnauPublisher:Cengage Learning
  Elementary Statistics: Picturing the World (7th E...StatisticsISBN:9780134683416Author:Ron Larson, Betsy FarberPublisher:PEARSON
 The Basic Practice of StatisticsStatisticsISBN:9781319042578Author:David S. Moore, William I. Notz, Michael A. FlignerPublisher:W. H. Freeman
 Introduction to the Practice of StatisticsStatisticsISBN:9781319013387Author:David S. Moore, George P. McCabe, Bruce A. CraigPublisher:W. H. Freeman
MATLAB: An Introduction with Applications
Statistics
ISBN:9781119256830
Author:Amos Gilat
Publisher:John Wiley & Sons Inc
Probability and Statistics for Engineering and th...
Statistics
ISBN:9781305251809
Author:Jay L. Devore
Publisher:Cengage Learning
Statistics for The Behavioral Sciences (MindTap C...
Statistics
ISBN:9781305504912
Author:Frederick J Gravetter, Larry B. Wallnau
Publisher:Cengage Learning
Elementary Statistics: Picturing the World (7th E...
Statistics
ISBN:9780134683416
Author:Ron Larson, Betsy Farber
Publisher:PEARSON
The Basic Practice of Statistics
Statistics
ISBN:9781319042578
Author:David S. Moore, William I. Notz, Michael A. Fligner
Publisher:W. H. Freeman
Introduction to the Practice of Statistics
Statistics
ISBN:9781319013387
Author:David S. Moore, George P. McCabe, Bruce A. Craig
Publisher:W. H. Freeman