f. Make a histogram of the residuals. Which plot is correct? Residual plot 1 Residual plot Normal Residual plot 2 Residual plot Normal 5.0 25 20 1.3 10 as 0.0 0.0 Which plot is correct? Residual Mean 40422-52 10 2000 -2000 1000 2000 Residual Men 402-12 ཧཱུྃ་ཧཱུྃ་ཧཱུྃ་ཤཾ་ཀྲྀ་ཧཱུཾ་སྒོ Residual plot 3 Residual plot 2000 -3000 3000 2000 Residual Mean An-12 D N 4249 g. Make a scatter diagram of the residual values versus the fitted values. Which plot is correct? Residuals vs Fits 1 Residuals vs. Fits Residuals vs Fits 2 Residuals vs. Fits 2000 1300 1000- 300 500 -2000 -03 35000 40000 45000 30000 35000 40000 45000 50000 FITS FITS Which plot is correct? 5000 2000 1000 -1000 Residuals vs Fits 3 Residuals vs. Fits 35000 37500 40000 42500 FITS 47500 50000


A regional planner is studying the demographics of nine counties in the eastern region of an Atlantic seaboard state. She has gathered the following data:
| County | Median Income | Median Age | Coastal |
|---|---|---|---|
| A | $ 48,157 | 57.7 | 1 |
| B | 48,568 | 60.7 | 1 |
| C | 46,816 | 47.9 | 1 |
| D | 34,876 | 38.4 | 0 |
| E | 35,478 | 42.8 | 0 |
| F | 34,465 | 35.4 | 0 |
| G | 35,026 | 39.5 | 0 |
| H | 38,599 | 65.6 | 0 |
| I | 33,315 | 27.0 | 0 |
a. Is there a linear relationship between the median income and median age?
b. Which variable is the "dependent" variable?
Which variable is the "dependent" variable? Median age/Median Income
c-1. Use
c-2. Interpret the value of the slope in a simple regression equation.
d. Include the aspect that the county is "coastal" or not in a multiple linear regression analysis using a "dummy" variable.
e. Test each of the individual coefficients to see if they are significant.
| Predictor | t | p-value |
| Constant | ||
| Median Age | ||
| Coastal |
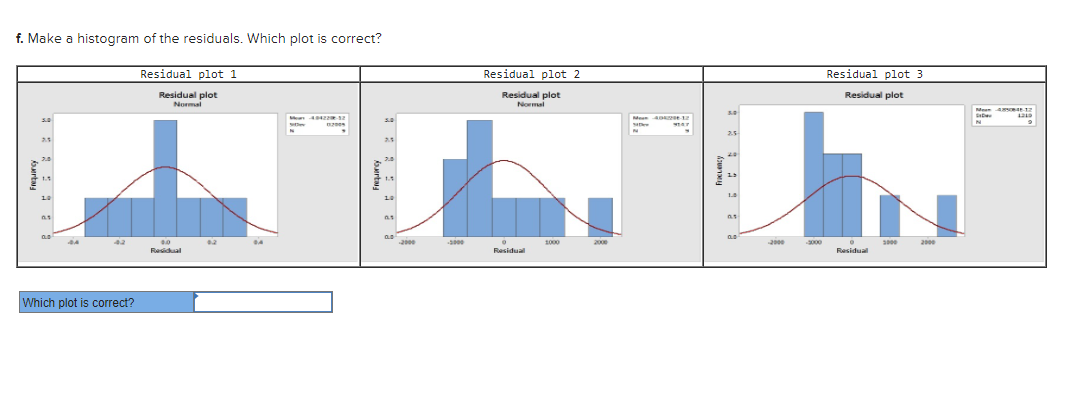
f. Make a histogram of the residuals. Which plot is correct?
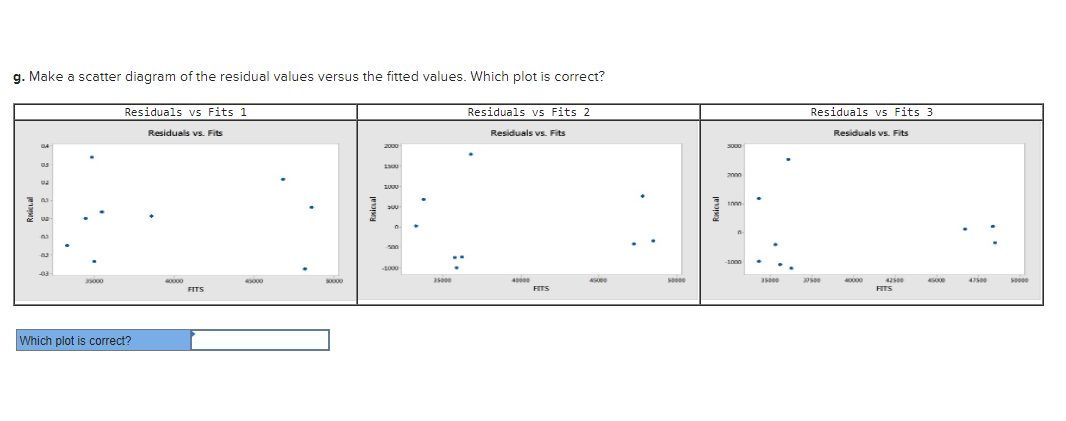
g. Make a


Trending now
This is a popular solution!

Step by step
Solved in 2 steps


