
MATLAB: An Introduction with Applications
6th Edition
ISBN: 9781119256830
Author: Amos Gilat
Publisher: John Wiley & Sons Inc
expand_more
expand_more
format_list_bulleted
Related questions
Question
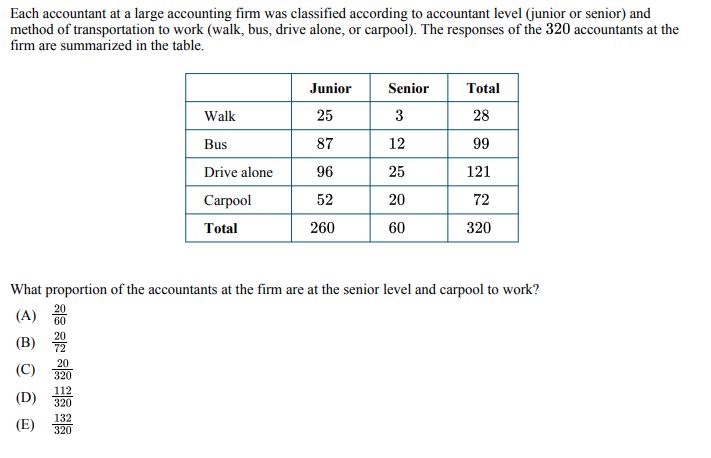

Transcribed Image Text:Each accountant at a large accounting firm was classified according to accountant level (junior or senior) and
method of transportation to work (walk, bus, drive alone, or carpool). The responses of the 320 accountants at the
firm are summarized in the table.
Junior
Senior
Total
Walk
25
3
28
Bus
87
12
99
Drive alone
96
25
121
Carpool
52
20
72
Total
260
60
320
What proportion of the accountants at the firm are at the senior level and carpool to work?
20
(A)
60
20
(B)
72
(C)
20
320
112
(D)
320
132
(E)
320
SAVE
AI-Generated Solution
info
AI-generated content may present inaccurate or offensive content that does not represent bartleby’s views.
Unlock instant AI solutions
Tap the button
to generate a solution
to generate a solution
Click the button to generate
a solution
a solution
Knowledge Booster

Similar questions
- Use the following results from a test for marijuana use, which is provided by a certain drug testing company. Among 141 subjects with positive test results, there are 23 false positive results. Among 157 negative results, there are 4 false negative results. Complete parts (a) through (c). (Hint: Construct a table.) a. How many subjects were included in the study? The total number of subjects in the study wasarrow_forwardDr. A. Ventura is interested in determining what kinds and how many pets people own in Bakersfield. He stands outside Petco and asks people what kind of pet they own. This is the result of his survey: dog=1; cat=2; bird=3; reptile=4; fish=5; other=6 1,1,2,2,2,1,1,3,2,3,1,1,1,2,2,4,4,2,2,1,1,1,5,4,3,4,1,1,1,2,2,6,1,1,2,2,1,2,1,2,6,3,4,5arrow_forwardThe director of library services at a college did a survey of types of books (by subject) in the circulation library. Then she used library records to take a random sample of 888 books checked out last term and classified the books in the sample by subject. The results are shown below. Subject Area Percent of Books on Subject in CirculationLibrary on This Subject Number of Books inSample on This Subject Business 32% 247 Humanities 25% 209 Natural Science 20% 222 Social Science 15% 127 All other subjects 8% 83 Using a 5% level of significance, test the claim that the subject distribution of books in the library fits the distribution of books checked out by students. (a) What is the level of significance?State the null and alternate hypotheses. H0: The distributions are the same.H1: The distributions are different.H0: The distributions are different.H1: The distributions are different. H0: The distributions are the same.H1: The distributions are the same.H0: The…arrow_forward
- A survey of 150 freshmen business students at a local university produced the results listed below. How many students took only religion? 35 took history;42 took science;43 took religion;19 took history but not science;14 took science and religion;15 took history and religion;6 took all threearrow_forward2.17. What is needed? Explain any flaws in each of the following proposed experiments and describe how you would improve the experiment. (a) Two product promotion offers are to be compared. The first, which offers two items for $2, will be used in a store on Friday. The second, which offers three items for $3, will be used in the same store on Saturday. (b) A study compares two marketing campaigns to encourage individuals to eat more fruits and vegetables. The first campaign is launched in Florida at the same time that the second campaign is launched in Minnesota. (c) You want to evaluate the effectiveness of a new investment strategy. You try the strategy for one year and evaluate the performance of the strategy.arrow_forwardUse the following results from a test for marijuana use, which is provided by a certain drug testing company. Among 140 subjects with positive test results, there are 30 false positive results. Among 159 negative results, there are 3 false negative results. Complete parts (a) through (c). (Hint: Construct a table.) a. How many subjects were included in the study? The total number of subjects in the study was ...arrow_forward
- The director of library services at a college did a survey of types of books (by subject) in the circulation library. Then she used library records to take a random sample of 888 books checked out last term and classified the books in the sample by subject. The results are shown below. Subject Area Percent of Books on Subject in CirculationLibrary on This Subject Number of Books inSample on This Subject Business 32% 284 Humanities 25% 218 Natural Science 20% 207 Social Science 15% 102 All other subjects 8% 77 (b) Find the value of the chi-square statistic for the sample. (Round the expected frequencies to three decimal places. Round the test statistic to three decimal places.)arrow_forwardA survey of 400 college seniors resulted in the following crosstabulation regarding their undergraduate major and whether or not they plan to go to graduate school. Undergraduate Major Graduate School Business Engineering Other Total Yes 33 43 61 137 No 90 105 68 263 Total 123 148 129 400 What percentage of the students' undergraduate major is Engineering? a. 65.75% b. 520% c. 152% d. 37%arrow_forwardThe level of water usage of 250 houses was rated in a survey as low, medium or high and the size of the houses as small, standard or large. The variables,level of water usage and size of house, as recorded in this survey, are a. both numerical variables. b. both categorical variables. c. neither numerical nor categorical variables. d. numerical and categorical variables respectively.arrow_forward
- The director of library services at a college did a survey of types of books (by subject) in the circulation library. Then she used library records to take a random sample of 888 books checked out last term and classified the books in the sample by subject. The results are shown below. Subject Area Percent of Books on Subject in CirculationLibrary on This Subject Number of Books inSample on This Subject Business 32% 267 Humanities 25% 217 Natural Science 20% 222 Social Science 15% 109 All other subjects 8% 73 Using a 5% level of significance, test the claim that the subject distribution of books in the library fits the distribution of books checked out by students. (a) What is the level of significance?State the null and alternate hypotheses. H0: The distributions are different.H1: The distributions are the same.H0: The distributions are the same.H1: The distributions are different. H0: The distributions are the same.H1: The distributions are the same.H0: The…arrow_forwardAmy has two ways to travel from her home in Norco to her office in Los Angeles. One is to go via the 10 Freeway, and the other is to go via 60 Freeway. In order to determine which way she should travel on a daily basis, Amy has recorded the travel times for samples of eight trips via the 10 Freeway and eight trips via the 60 Freeway. The following table gives the travel times (in minutes) for the sixteen trips: Travel times in minutes 10 Freeway 73, 69, 72, 71, 73, 73, 72, 73 60 Freeway 80, 75, 68, 72, 73, 81, 67, 75 Assume that the two populations of travel times are normally distributed and that the population variances are equal. Can we conclude, at the 0.1 level of significance, that the mean travel times of the two routes are different? Perform a two-tailed test. Then fill in the table below. Carry your intermediate computations to at least three decimal places and round your answers as specified in the table. (If necessary, consult a list…arrow_forwardA movie club surveyed 250 high school students. The students were asked how often they go to the movies and whether they prefer comedies or dramas. Their responses are summarized in the following table. Twice a monthor less Three times a monthor more Comedy 85 35 Drama 100 30 (a) What percentage of the students prefer dramas ? (b) What percentage of the students go to the movies twice a month or less?arrow_forward
arrow_back_ios
SEE MORE QUESTIONS
arrow_forward_ios
Recommended textbooks for you
- MATLAB: An Introduction with ApplicationsStatisticsISBN:9781119256830Author:Amos GilatPublisher:John Wiley & Sons Inc
 Probability and Statistics for Engineering and th...StatisticsISBN:9781305251809Author:Jay L. DevorePublisher:Cengage Learning
 Statistics for The Behavioral Sciences (MindTap C...StatisticsISBN:9781305504912Author:Frederick J Gravetter, Larry B. WallnauPublisher:Cengage Learning
  Elementary Statistics: Picturing the World (7th E...StatisticsISBN:9780134683416Author:Ron Larson, Betsy FarberPublisher:PEARSON
 The Basic Practice of StatisticsStatisticsISBN:9781319042578Author:David S. Moore, William I. Notz, Michael A. FlignerPublisher:W. H. Freeman
 Introduction to the Practice of StatisticsStatisticsISBN:9781319013387Author:David S. Moore, George P. McCabe, Bruce A. CraigPublisher:W. H. Freeman
MATLAB: An Introduction with Applications
Statistics
ISBN:9781119256830
Author:Amos Gilat
Publisher:John Wiley & Sons Inc
Probability and Statistics for Engineering and th...
Statistics
ISBN:9781305251809
Author:Jay L. Devore
Publisher:Cengage Learning
Statistics for The Behavioral Sciences (MindTap C...
Statistics
ISBN:9781305504912
Author:Frederick J Gravetter, Larry B. Wallnau
Publisher:Cengage Learning
Elementary Statistics: Picturing the World (7th E...
Statistics
ISBN:9780134683416
Author:Ron Larson, Betsy Farber
Publisher:PEARSON
The Basic Practice of Statistics
Statistics
ISBN:9781319042578
Author:David S. Moore, William I. Notz, Michael A. Fligner
Publisher:W. H. Freeman
Introduction to the Practice of Statistics
Statistics
ISBN:9781319013387
Author:David S. Moore, George P. McCabe, Bruce A. Craig
Publisher:W. H. Freeman