$1,000,000- $500.000- 7,500 15.000 22.500 30,000 37,500 45.000 A B C. Total cost $2,500,000- $2.000.000 $1,500,000- $1.000.000- $500,000 ис $1,000,000- $500,000 Units Units 7.500 15,000 22.500 30.000 37,500 45.000 D A B C D D. Total cost $2,500,000 $2.000.000 $1.500.000- $1,000,000- $500,000- Units 7.500 15.000 22.500 30.000 37.500 45.000 ША B с D Units 7.500 15.000 22.500 30.000 37.500 45,000 A IB С b. Find the break-even points and determine the range of demand for which each location has a cost advantage. Do not round intermediate calculations. Round your answers to the nearest whole number. At Q less than the break-even point, which location has Locations Break-even point (units) A-B A-C a cost advantage? -Select- -Select- ▼ A-D -Select- B-C -Select- B-D C-D At Q more than the break-even point, which location has a cost advantage? -Select- v -Select- v -Select- -Select- v -Select- v -Select- v -Select- v -Select- c. The sales manager predicts that demand will be 28,000 units. Which facility is best for the predicted demand? Do not round intermediate calculations. Round your answer to the nearest dollar. Location -Select- is best for the predicted demand because it results in the lowest total cost of $
$1,000,000- $500.000- 7,500 15.000 22.500 30,000 37,500 45.000 A B C. Total cost $2,500,000- $2.000.000 $1,500,000- $1.000.000- $500,000 ис $1,000,000- $500,000 Units Units 7.500 15,000 22.500 30.000 37,500 45.000 D A B C D D. Total cost $2,500,000 $2.000.000 $1.500.000- $1,000,000- $500,000- Units 7.500 15.000 22.500 30.000 37.500 45.000 ША B с D Units 7.500 15.000 22.500 30.000 37.500 45,000 A IB С b. Find the break-even points and determine the range of demand for which each location has a cost advantage. Do not round intermediate calculations. Round your answers to the nearest whole number. At Q less than the break-even point, which location has Locations Break-even point (units) A-B A-C a cost advantage? -Select- -Select- ▼ A-D -Select- B-C -Select- B-D C-D At Q more than the break-even point, which location has a cost advantage? -Select- v -Select- v -Select- -Select- v -Select- v -Select- v -Select- v -Select- c. The sales manager predicts that demand will be 28,000 units. Which facility is best for the predicted demand? Do not round intermediate calculations. Round your answer to the nearest dollar. Location -Select- is best for the predicted demand because it results in the lowest total cost of $

Chapter6: Proudction Costs
Section: Chapter Questions
Problem 8SQP

Related questions
Question
Give answer of all questions and take like
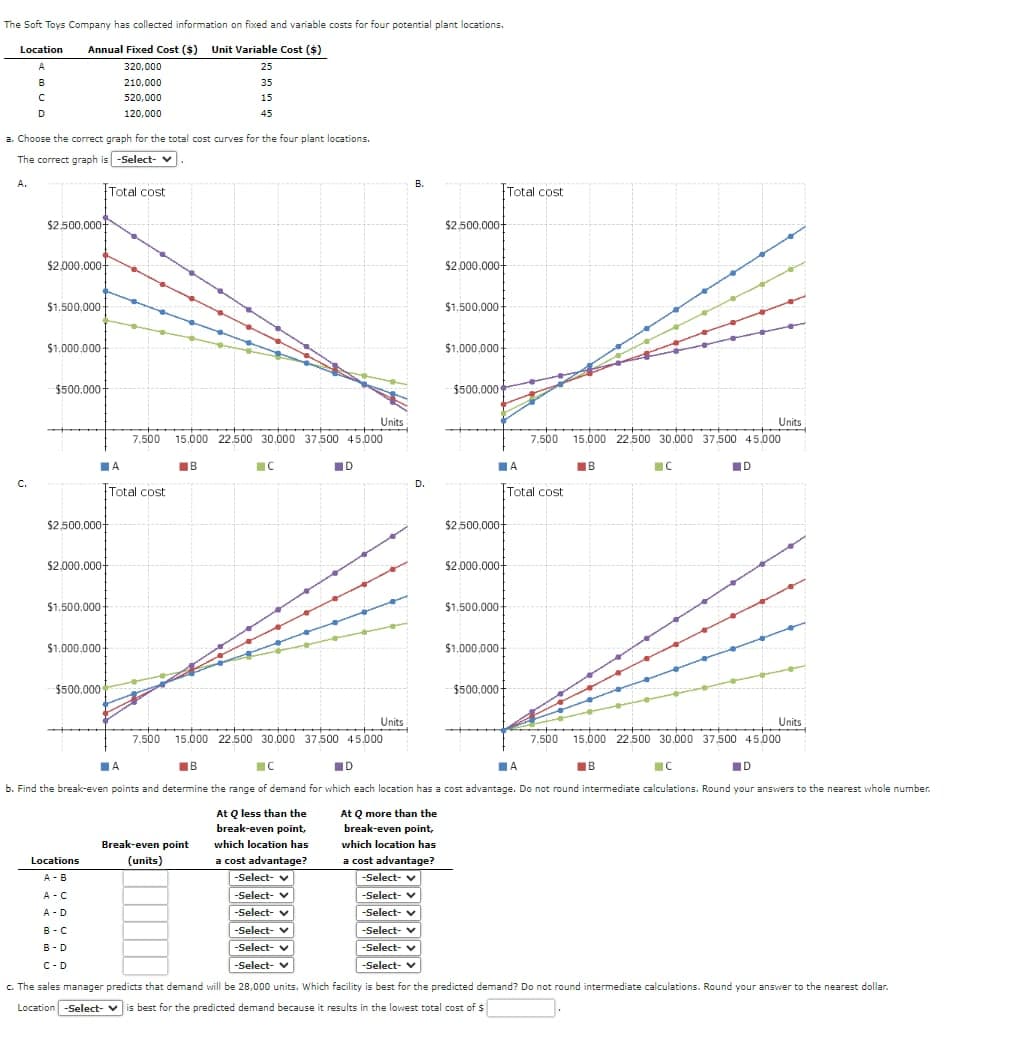
Transcribed Image Text:The Soft Toys Company has collected information on fixed and variable costs for four potential plant locations.
Annual Fixed Cost ($) Unit Variable Cost ($)
Location
A
B
C
D
320,000
210,000
520,000
120,000
25
35
15
45
a. Choose the correct graph for the total cost curves for the four plant locations.
The correct graph is -Select- v
A.
$2,500,000
$2,000,000-
$1,500,000-
$1,000,000-
$500,000
Total cost
7.500 15.000 22.500 30.000 37.500 45,000
ША
B
C.
Total cost
$2.500.000-
$2.000.000-
$1,500,000-
$1,000,000
$500,000
C
Units
B.
Total cost
$2,500,000-
$2,000,000-
$1,500,000
$1,000,000
$500.000
7.500 15,000 22.500 30.000 37,500 45.000
D
ША
B
D.
Total cost
$2,500,000-
7.500 15.000 22.500 30.000 37,500 45.000
B
с
ID
Units
$2,000,000-
$1.500.000-
$1,000,000-
$500,000+
C
D
Units
Units
7.500 15.000 22.500 30.000 37,500 45,000
B
C
■D
b. Find the break-even points and determine the range of demand for which each location has a cost advantage. Do not round intermediate calculations. Round your answers to the nearest whole number.
Locations
Break-even point
(units)
A-B
A-C
A-D
B-C
B-D
C D
At Q less than the
break-even point,
which location has
a cost advantage?
-Select- ✓
At Q more than the
break-even point,
which location has
a cost advantage?
-Select- ✓
-Select- ✓
-Select- ▼
-Select- v
-Select- ✓
-Select- v
-Select- v
-Select-
-Select- ✓
-Select- ✓
-Select- ✓
c. The sales manager predicts that demand will be 28,000 units. Which facility is best for the predicted demand? Do not round intermediate calculations. Round your answer to the nearest dollar.
Location -Select- is best for the predicted demand because it results in the lowest total cost of $
Expert Solution
This question has been solved!
Explore an expertly crafted, step-by-step solution for a thorough understanding of key concepts.
Step 1: Define the Problem:
VIEWStep 2: Choose the correct Graph
VIEWSolution
VIEWStep 3: Break - Even for Locations A and B
VIEWStep 4: Break - Even for Locations A and C
VIEWStep 5: Break - Even for Locations A and D
VIEWStep 6: Break - Even for Locations B and C
VIEWStep 7: Break - Even for Locations B and D
VIEWStep 8: Break - Even for Locations C and D
VIEWStep 9: Complete the table:
VIEWStep 10: TC for 28,000 Units
VIEW
Step by step
Solved in 11 steps with 6 images

Recommended textbooks for you


Managerial Economics: Applications, Strategies an…
Economics
ISBN:
9781305506381
Author:
James R. McGuigan, R. Charles Moyer, Frederick H.deB. Harris
Publisher:
Cengage Learning
Managerial Economics: Applications, Strategies an…
Economics
ISBN:
9781305506381
Author:
James R. McGuigan, R. Charles Moyer, Frederick H.deB. Harris
Publisher:
Cengage Learning

Managerial Economics: A Problem Solving Approach
Economics
ISBN:
9781337106665
Author:
Luke M. Froeb, Brian T. McCann, Michael R. Ward, Mike Shor
Publisher:
Cengage Learning

Principles of Economics 2e
Economics
ISBN:
9781947172364
Author:
Steven A. Greenlaw; David Shapiro
Publisher:
OpenStax
