
MATLAB: An Introduction with Applications
6th Edition
ISBN: 9781119256830
Author: Amos Gilat
Publisher: John Wiley & Sons Inc
expand_more
expand_more
format_list_bulleted
Related questions
Question
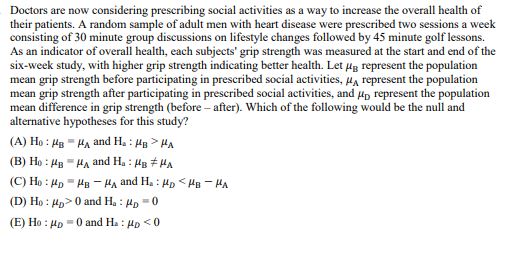

Transcribed Image Text:Doctors are now considering prescribing social activities as a way to increase the overall health of
their patients. A random sample of adult men with heart disease were prescribed two sessions a week
consisting of 30 minute group discussions on lifestyle changes followed by 45 minute golf lessons.
As an indicator of overall health, each subjects' grip strength was measured at the start and end of the
six-week study, with higher grip strength indicating better health. Let μg represent the population
mean grip strength before participating in prescribed social activities, μA represent the population
mean grip strength after participating in prescribed social activities, and μ represent the population
mean difference in grip strength (before-after). Which of the following would be the null and
alternative hypotheses for this study?
(A) Ho HB HA and H.: HB>HA
(B) Ho MBA and H.: HB #HA
(C) Ho Mp MB -HA and H. HD <HB-HA
(D) Ho: p>0 and H.: μp=0
(E) Hop 0 and Ha: p<0
SAVE
AI-Generated Solution
info
AI-generated content may present inaccurate or offensive content that does not represent bartleby’s views.
Unlock instant AI solutions
Tap the button
to generate a solution
to generate a solution
Click the button to generate
a solution
a solution
Knowledge Booster

Similar questions
- Recent research indicates that the effectiveness of antidepressant medication is directly related to the severity of the depression (Khan, Brodhead, Kolts & Brown, 2005). Based on pretreatment depression scores, patients were divided into four groups based on their level of depression. After receiving the antidepressant medication, depression scores were measured again and the amount of improvement was recorded for each patient. The following data are similar to the results of the study. F-ratio: Low Moderate p-value: 2.2 3.1 0.6 2.6 0.5 0 High Moderate 1.5 2.1 3.3 2.3 2.1 4.6 Moderately Severe 2.7 4.7 4.7 4.6 3.7 3.3 From this table, conduct ANOVA. Calculate the F-ratio and p-value. Be sure to round your answers to three decimal places. Severe 3.8 2.4 5.3 4.7 4.2 4 What is your final conclusion? Use a significance level of a = 0.02. O There is sufficient evidence that there exists a significant difference between treatments. O There is not enough evidence to determine a difference…arrow_forwardRide services are on the rise, such as Uber and Lyft. You wondered if the recent news reports of crime occurring with these ride services impacted the usage of them, especially with women. You decide to conduct a survey about ride service usage among male and female college students. The results showed that 19 males use ride services and 11 do not. While 12 females use ride services and 18 do not. Calculate the degrees of freedom:arrow_forwardWhat is the summary of the overall model of the data shown in question 1? Is it one that you would trust from a statistical standpoint? specifically why ?arrow_forward
- A study was performed to determine the percentage of people who wear life vests while out on the water. A researcher believed that the percentage was different for those who rode jet skis compared to those who were in boats. Out of 500500 randomly selected people who rode a jet ski, 85%85% wore life vests. Out of 250250 randomly selected boaters, 90.4%90.4% wore life vests. Using a 0.050.05 level of significance, test the claim that the proportion of people who wear life vests while riding a jet ski is not the same as the proportion of people who wear life vests while riding in a boat. Let jet skiers be Population 1 and let boaters be Population 2. Step 1 of 3 : State the null and alternative hypotheses for the test. Fill in the blank below. H0Ha: p1=p2: p1⎯⎯⎯⎯⎯⎯⎯⎯⎯⎯⎯⎯⎯⎯⎯p2 Step 2 of 3 : Compute the value of the test statistic. Round your answer to two decimal places. 3) draw a conclusion and form a decision (word it like "we fail to reject the null hypothesis and…arrow_forwardA group of disabled women ages 65 and older were followed for several years. It was found that those who had a vitamin B12 deficiency were twice as likely to suffer from severe depressions than those who did not.a. Describe the type of study being performed.b. Describe the explanatory variable(s) and response variable(s).arrow_forwardWhat was the power for this study?arrow_forward
- A food-frequency questionnaire is used to measure dietary intake. The respondent specifies the number of servings of various food items they consumed over the previous week. The dietary cholesterol is then quantified for each respondent. The researchers were interested in assessing if there was an association between dietary cholesterol intake and high blood pressure. In a large sample of individuals who had completed the questionnaire, 250 persons with a high dietary cholesterol intake (greater than 300 mg /day) were selected and 250 persons with a low dietary cholesterol intake (less than 300 mg/day) were selected. The 500 selected participants had their medical history taken and were classified as having normal or high blood pressure. The data are given here. Dietary Cholesterol Blood Pressure Total High Low High 159 91 250 Low 78 172 250 Total 237 263 500 Test 2: two-tailed test for comparing two independent proportions Clearly state…arrow_forwardOn occasion, medical studies need to model the proportion of the population that has a disease and compare that to observed frequencies of the disease actually occurring. Suppose the end-stage renal failure in south-west Wales was collected for different age groups. Do the data in the table show that the observed frequencies are in agreement with proportion of people in each age group? Test at the 1% level. Renal Failure Frequencies Age group 16-29 30-44 45-59 60-74 75+ Total Observed Frequencies 125 152 134 124 48 583 Expected Proportion 0.23 0.25 0.22 0.21 0.09 State the hypotheses.H0: The observed frequencies in agreement with proportion of people in each age group.Ha: The observed frequencies in agreement with proportion of people in each age group. Calculate the χ2 test statistic. Round expected values to two decimal places. Round χ2 to 3 decimal places.χ2 = Calculate the p-value. Round to 3 decimal places.p-value = State your decision.Since p-value α,…arrow_forwardA college administrator wants to know if there is a significant difference between sexual orientation and level of family support for students at their college. The administrator takes a random sample of students who identify as gay/lesbian, bisexual or heterosexual/straight. There were 22 students sampled in each category. A measure of family support is given with higher scores indicating more family support. The means are as follows: Gay/lesbian Bisexual Heterosexual/Straight MG/L = 16 MBi = 17 MH/S = 22 Source SS df MS F Orientation 300 Error 2961 Total What is the value of df total?arrow_forward
- Ride services are on the rise, such as Uber and Lyft. You wondered if the recent news reports of crime occurring with these ride services impacted the usage of them, especially with women. You decide to conduct a survey about ride service usage among male and female college students. The results showed that 19 males use ride services and 11 do not. While 12 females use ride services and 18 do not. Calculate the chi-square statistic:arrow_forwardA program administrator at a high school wanted to see if there was a significant association between experiencing verbal abuse and anxiety in teenage women. She wasn't sure what to expect. Perform the correct statistical procedure to assess the degree of association between these variables and interpret your findings. Set alpha = .05 for your statistical test. YOU CAN EITHER TYPE YOUR WORK OUT HERE OR TAKE A PICTURE OF HANDWRITTEN WORK AND EMAIL IT TO ME. %3D Anxiety Verbal Abuse 5. 4. 4.arrow_forwardWhat type of study is this? A first-year university unit wanted to give option of online teaching to determine whether online teaching improved learning outcomes. Students were allowed to enrol into online or on-campus classes. Grades at the end of semester were compared. Select one: O Experimental O Something else O Observationalarrow_forward
arrow_back_ios
SEE MORE QUESTIONS
arrow_forward_ios
Recommended textbooks for you
- MATLAB: An Introduction with ApplicationsStatisticsISBN:9781119256830Author:Amos GilatPublisher:John Wiley & Sons Inc
 Probability and Statistics for Engineering and th...StatisticsISBN:9781305251809Author:Jay L. DevorePublisher:Cengage Learning
 Statistics for The Behavioral Sciences (MindTap C...StatisticsISBN:9781305504912Author:Frederick J Gravetter, Larry B. WallnauPublisher:Cengage Learning
  Elementary Statistics: Picturing the World (7th E...StatisticsISBN:9780134683416Author:Ron Larson, Betsy FarberPublisher:PEARSON
 The Basic Practice of StatisticsStatisticsISBN:9781319042578Author:David S. Moore, William I. Notz, Michael A. FlignerPublisher:W. H. Freeman
 Introduction to the Practice of StatisticsStatisticsISBN:9781319013387Author:David S. Moore, George P. McCabe, Bruce A. CraigPublisher:W. H. Freeman
MATLAB: An Introduction with Applications
Statistics
ISBN:9781119256830
Author:Amos Gilat
Publisher:John Wiley & Sons Inc
Probability and Statistics for Engineering and th...
Statistics
ISBN:9781305251809
Author:Jay L. Devore
Publisher:Cengage Learning
Statistics for The Behavioral Sciences (MindTap C...
Statistics
ISBN:9781305504912
Author:Frederick J Gravetter, Larry B. Wallnau
Publisher:Cengage Learning
Elementary Statistics: Picturing the World (7th E...
Statistics
ISBN:9780134683416
Author:Ron Larson, Betsy Farber
Publisher:PEARSON
The Basic Practice of Statistics
Statistics
ISBN:9781319042578
Author:David S. Moore, William I. Notz, Michael A. Fligner
Publisher:W. H. Freeman
Introduction to the Practice of Statistics
Statistics
ISBN:9781319013387
Author:David S. Moore, George P. McCabe, Bruce A. Craig
Publisher:W. H. Freeman