Construct a 98% confidence interval about if the sample size, n, is 16. Construct a 98% confidence interval about u if the sample size, n, is 26. Construct a 99% confidence interval about u if the sample size, n, is 16. Could we have computed the confidence intervals in parts (a)-(c) if the population had not been normally distributed? Click the icon to view the table of areas under the t-distribution. Construct a 98% confidence interval about u if the sample size, n, is 16. wer bound: Upper bound: se ascending order. Round to one decimal place as needed.)
Construct a 98% confidence interval about if the sample size, n, is 16. Construct a 98% confidence interval about u if the sample size, n, is 26. Construct a 99% confidence interval about u if the sample size, n, is 16. Could we have computed the confidence intervals in parts (a)-(c) if the population had not been normally distributed? Click the icon to view the table of areas under the t-distribution. Construct a 98% confidence interval about u if the sample size, n, is 16. wer bound: Upper bound: se ascending order. Round to one decimal place as needed.)
Glencoe Algebra 1, Student Edition, 9780079039897, 0079039898, 2018
18th Edition
ISBN:9780079039897
Author:Carter
Publisher:Carter
Chapter10: Statistics
Section10.5: Comparing Sets Of Data
Problem 4CYU
Related questions
Question

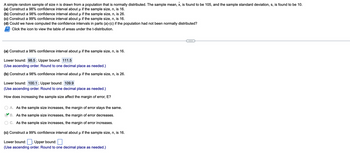
Transcribed Image Text:A simple random sample of size n is drawn from a population that is normally distributed. The sample mean, x, is found to be 105, and the
sample standard deviation, s, is found to be 10.
(a) Construct a 98% confidence interval about u if the sample size, n, is 16.
(b) Construct a 98% confidence interval about u if the sample size, n, is 26.
(c) Construct a 99% confidence interval about u if the sample size, n, is 16.
(d) Could we have computed the confidence intervals in parts (a)-(c) if the population had not been normally distributed?
Click the icon to view the table of areas under the t-distribution.
(a) Construct a 98% confidence interval about u if the sample size, n, is 16.
μ
Lower bound::Upper bound:
(Use ascending order. Round to one decimal place as needed.)

Transcribed Image Text:6:38
Table of t-Distribution Areas
0.25
1
2
3
4 0.741
5
9
0
1.000 1.376 1.963
0.816
1.061
1.386
0.765 0.978
1.250
0.941
1.190
1.156
0.727 0.920
6
7
8 0.688
0.20
1 0.697 0.876 1.088
2 0.695 0.873
1.083
3 0.694 0.870 1.079
0.868 1.076
4
0.692
5
0.691
0.866
1.074
-Area in
right tail
0.690 0.865
0.689
0.688
0.687
1
2 0.682
6 0.684 0.856
7 0.684
0.855
8 0.683 0.855
9
0.683 0.854
0
0.683 0.854
0.25
0.15
1.071
1.069
0.863
0.862
1.067
0.861 1.066
0.860
solve this
6 0.718 0.906
1.134
1.440 1.943
2.447
2.612 3.143
3.707
7
2.365 2.517 2.998
3.499
3.250
3.169
0.711 0.896
1.119 1.415 1.895
8 0.706 0.889 1.108 1.397 1.860 2.306 2.449 2.896 3.355
9 0.703 0.883 1.100 1.383 1.833 2.262 2.398 2.821
0 0.700 0.879 1.093 1.372 1.812 2.228 2.359 2.764
1.363 1.796 2.201 2.328 2.718
1.356 1.782 2.179 2.303 2.681
1.350 1.771 2.160
1.345 1.761 2.145
1.341 1.753 2.131
2.282 2.650
2.264 2.624
2.249 2.602
0.682 0.853
0.853
0.682 0.853
3
4
0.682 0.852
5 0.682 0.852
0.20
0.10
0.05
3.078 6.314
1.886 2.920
1.638 2.353
1.533 2.132
1.476
2.015
1.337 1.746
1.333 1.740
1.330 1.734
1.328 1.729
1.064 1.325 1.725
0.15 0.10
|||
Table VI
t-Distribution
Area in Right Tail
0.025
12.706
4.303
3.182
2.776
2.571
1
2.080
2.189
2.831
2.074
2.183
2.819
2.500 2.807
2.492 2.797
2.167 2.485 2.787
0.686 0.859 1.063 1.323 1.721
2 0.686 0.858 1.061 1.321 1.717
3 0.685 0.858 1.060 1.319 1.714
4 0.685 0.857
1.059 1.318 1.711
5 0.684 0.856 1.058 1.316 1.708
1.058 1.315 1.706
1.057 1.314 1.703
1.056 1.313 1.701
1.055 1.311 1.699 2.045 2.150 2.462 2.756
1.055 1.310 1.697 2.042 2.147
1.054 1.309 1.696 2.040 2.144
1.054 1.309 1.694 2.037 2.141
1.053 1.308 1.692
1.052 1.307 1.691
1.052 1.306 1.690
2.069 2.177
2.064 2.172
2.060
2.056 2.162 2.479 2.779
2.052 2.158 2.473 2.771
2.048 2.154 2.467 2.763
2.457 2.750
2.453
2.449 2.738
2.744
2.733
2.136 2.441 2.728
2.133
2.438
2.724
2.131
2.434
2.719
2.431 2.715
2.429 2.712
2.035 2.138 2.445
2.032
2.030
6 0.681 0.852 1.052 1.306 1.688 2.028
7 0.681 0.851 1.051 1.305 1.687 2.026 2.129
8 0.681 0.851 1.051 1.304 1.686 2.024 2.127
9 0.681 0.851 1.050 1.304 1.685 2.023 2.125
2.426 2.708
0 0.681 0.851 1.050 1.303 1.684 2.021 2.123 2.423 2.704
0.679
0.849 1.047 1.299 1.676 2.009 2.109
0 0.679 0.848 1.045 1.296 1.671 2.000 2.099
0 0.678 0.847 1.044 1.294 1.667 1.994 2.093
0.678 0.846 1.043 1.292 1.664 1.990 2.088
0.677 0.846 1.042 1.291 1.662 1.987 2.084
1.984 2.081
1.962 2.056 2.330 2.581
1.960 2.054 2.326 2.576
0
0
0
0 0.677 0.845 1.042 1.290 1.660
0 0.675 0.842 1.037 1.282 1.646
0.674 0.842 1.036 1.282 1.645
2.364 2.626
0.05
0.02
0.025
Print
View an example Get more help
0.01
15.894
31.821
4.849 6.965
3.482
4.541 5.841
2.999 3.747 4.604
2.757
3.365
4.032
2.921
2.120 2.235 2.583
2.110 2.224 2.567 2.898
2.878
2.101 2.214
2.093 2.205
2.086 2.197
2.552
2.539 2.861
2.528 2.845
Area in Right Tail
0.02
2.518
2.508
0.005 0.0025
63.657 127.321 318.309
9.925 14.089 22.327
7.453 10.215
5.598
7.173
4.773
5.893
0.01
3.106
3.055
3.012
2.977
2.947
Done
2.403 2.678
2.390 2.660
2.381 2.648
2.374 2.639
2.368 2.632
27% الله ؟
0.005
4.317
4.029
3.833
3.690
3.581
3.497
3.428
3.372
3.326
3.286
3.252
3.222
3.197
3.174
3.153
3.135
3.119
3.104
3.091
3.078
3.067
3.057
3.047
3.038
3.030
3.022
3.015
3.008
3.002
2.996
2.990
2.985
2.980
2.976
2.971
2.937
2.915
2.899
2.887
2.878
2.871
2.813
2.807
0.0025
0.001
<
5.208
4.785
4.501
4.297
4.144
4.025
3.930
3.852
3.787
3.733
3.686
3.646
3.610
3.579
3.552
3.527
3.505
3.485
3.467
3.450
3.435
3.421
3.408
3.396
3.385
3.375
3.365
3.356
3.348
3.340
3.333
3.326
3.319
3.313
3.307
3.261
3.232
3.211
3.195
3.183
3.174
3.098
3.090
0.001
Clear all
0.0005
636.619
31.599
12.924
8.610
6.869
5.959
5.408
5.041
4.781
4.587
4.437
4.318
4.221
4.140
4.073
4.015
3.965
3.922
3.883
3.850
3.819
3.792
3.768
3.745
3.725
3.707
3.690
3.674
3.659
3.646
3.633
3.622
3.611
3.601
3.591
3.582
3.574
3.566
3.558
3.551
3.496
3.460
3.435
3.416
3.402
3.390
3.300
3.291
0.0005
Check
Expert Solution
This question has been solved!
Explore an expertly crafted, step-by-step solution for a thorough understanding of key concepts.
Step by step
Solved in 3 steps with 1 images

Follow-up Questions
Read through expert solutions to related follow-up questions below.
Follow-up Question

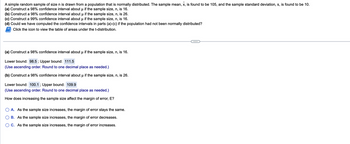
Transcribed Image Text:A simple random sample of size n is drawn from a population that is normally distributed. The sample mean, x, is found to be 105, and the sample standard deviation, s, is found to be 10.
(a) Construct a 98% confidence interval about µ if the sample size, n, is 16.
μ
(b) Construct a 98% confidence interval about µ if the sample size, n, is 26.
(c) Construct a 99% confidence interval about u if the sample size, n, is 16.
(d) Could we have computed the confidence intervals in parts (a)-(c) if the population had not been normally distributed?
Click the icon to view the table of areas under the t-distribution.
(a) Construct a 98% confidence interval about µ if the sample size, n, is 16.
μ
Lower bound: 98.5; Upper bound: 111.5
(Use ascending order. Round to one decimal place as needed.)
(b) Construct a 98% confidence interval about µ if the sample size, n, is 26.
Lower bound: 100.1 ; Upper bound: 109.9
(Use ascending order. Round to one decimal place as needed.)
How does increasing the sample size affect the margin of error, E?
A. As the sample size increases, the margin of error stays the same.
B. As the sample size increases, the margin of error decreases.
C. As the sample size increases, the margin of error increases.
(c) Construct a 99% confidence interval about µ if the sample size, n, is 16.
Lower bound:; Upper bound:
(Use ascending order. Round to one decimal place as needed.)
Solution
Follow-up Question
Cn you make your answer more clearer cant see the writing
Solution
Follow-up Question

Transcribed Image Text:A simple random sample of size n is drawn from a population that is normally distributed. The sample mean, x, is found to be 105, and the sample standard deviation, s, is found to be 10.
(a) Construct a 98% confidence interval about µ if the sample size, n, is 16.
μ
(b) Construct a 98% confidence interval about µ if the sample size, n, is 26.
(c) Construct a 99% confidence interval about µ if the sample size, n, is 16.
(d) Could we have computed the confidence intervals in parts (a)-(c) if the population had not been normally distributed?
Click the icon to view the table of areas under the t-distribution.
(a) Construct a 98% confidence interval about µ if the sample size, n, is 16.
μ
Lower bound: 98.5; Upper bound: 111.5
(Use ascending order. Round to one decimal place as needed.)
(b) Construct a 98% confidence interval about µ if the sample size, n, is 26.
Lower bound: 100.1 ; Upper bound: 109.9
(Use ascending order. Round to one decimal place as needed.)
How does increasing the sample size affect the margin of error, E?
A. As the sample size increases, the margin of error stays the same.
B. As the sample size increases, the margin of error decreases.
C. As the sample size increases, the margin of error increases.
Solution
Recommended textbooks for you

Glencoe Algebra 1, Student Edition, 9780079039897…
Algebra
ISBN:
9780079039897
Author:
Carter
Publisher:
McGraw Hill

Calculus For The Life Sciences
Calculus
ISBN:
9780321964038
Author:
GREENWELL, Raymond N., RITCHEY, Nathan P., Lial, Margaret L.
Publisher:
Pearson Addison Wesley,

Glencoe Algebra 1, Student Edition, 9780079039897…
Algebra
ISBN:
9780079039897
Author:
Carter
Publisher:
McGraw Hill

Calculus For The Life Sciences
Calculus
ISBN:
9780321964038
Author:
GREENWELL, Raymond N., RITCHEY, Nathan P., Lial, Margaret L.
Publisher:
Pearson Addison Wesley,