
Essentials Of Investments
11th Edition
ISBN: 9781260013924
Author: Bodie, Zvi, Kane, Alex, MARCUS, Alan J.
Publisher: Mcgraw-hill Education,
expand_more
expand_more
format_list_bulleted
Related questions
Question

Transcribed Image Text:owing income statement accounts in the popup window, E
t for the year.
ow for the year.
Data Table
nt for the year.
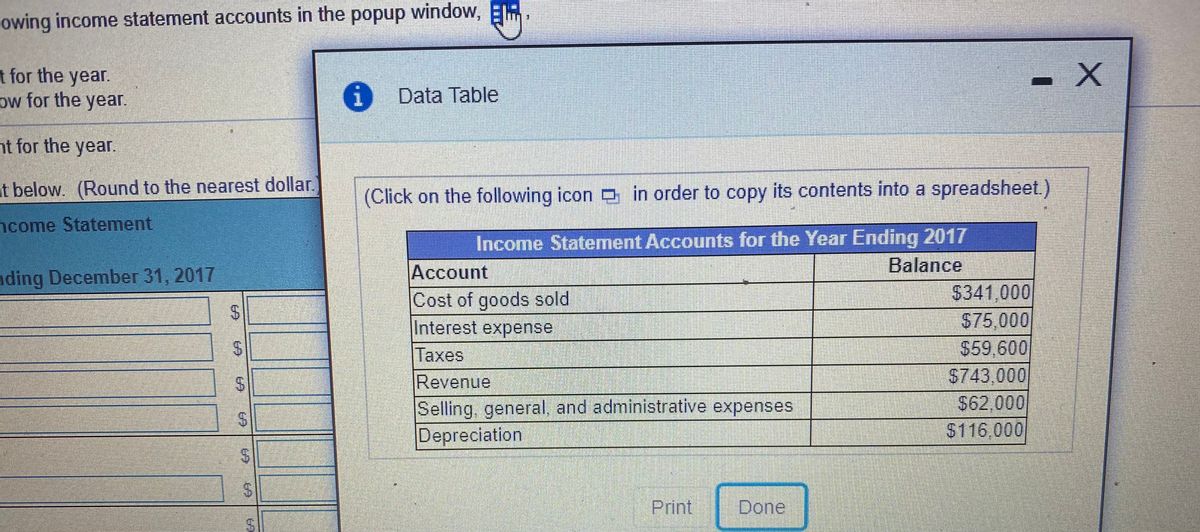
at below. (Round to the nearest dollar.
(Click on the following icon in order to copy its contents into a spreadsheet.)
ncome Statement
Income Statement Accounts for the Year Ending 2017
Balance
nding December 31, 2017
Account
Cost of goods sold
Interest expense
Taxes
Revenue
Selling, general, and administrative expenses
Depreciation
$341,000
$75,000
59,600
S743,000
$62,000
$116,000
Print
Done
%24
%24
%24

Transcribed Image Text:a. produce the income statement for the year.
b. produce the operating cash flow for the year.
a. produce the income statement for the year,
Complete the income statement below. (Round to the nearest dollar.)
Income Statement
Year Ending December 31, 2017
EBIT
Taxable income
%24
%24
%24
%24
%24
%24
%24
Expert Solution
This question has been solved!
Explore an expertly crafted, step-by-step solution for a thorough understanding of key concepts.

This is a popular solution

Trending nowThis is a popular solution!

Step by stepSolved in 2 steps

Knowledge Booster


Learn more about
Need a deep-dive on the concept behind this application? Look no further. Learn more about this topic, finance and related others by exploring similar questions and additional content below.Similar questions
- What is the financial performance summary for this balance sheet? BALANCE SHEET INCOME STATEMENT ($ in millions) ($ in millions) ASSETS LIABILITIES Revenue 28,681.10 Cash & Marketable Securities 449.90 Accounts Payable 1,611.20 Cost Of Goods Sold 20,768.80 Accounts Receivable 954.80 Salaries Payable 225.20 Gross Profit 7,912.30 Inventories 3,645.20 Other Current Liabilities 1,118.80 Other Current Assets 116.60 Total Current Liabilities 2,955.20 Operating Expenses: Total Current Assets 5,166.50 Selling, General & Admin. 5,980.80 Other Liabilities 693.40 Depreciation 307.30 Machinery & Equipment 1,688.90 Operating income 1,624.20 Land 1,129.70 Total Liabilities 3,648.60 Buildings 2,348.40 Interest - Depreciation (575.60) SHAREHOLDER'S EQUITY Other Expense (Income) (13.10) Property, Plant & Equip. - Net…arrow_forwardFollowing are the jumbled information related to XYZ Company for the year 2016. Revenue 300,000 Equipment 150,000 Administration Expenses 40,000 Trade Receivable 50,000 Interest expense 10,000 Cost of goods sold 130,000 Tax 25,000 What will be the company's reported Gross profit and Net Income (Net Profit)? Gross Profit 130,000 and Net Profit 95,000 Gross Profit 170,000 and Net Profit 120,000 Gross Profit 130,000 and Net Profit 105,000 Gross Profit 170,000 and Net Profit 95,000arrow_forwardPortions of the financial statements for Peach Computer are provided below. PEACH COMPUTER Income Statement For the year ended December 31, 2024 Net sales Expenses: Cost of goods sold Operating expenses Depreciation expense Income tax expense Total expenses Net income Cash Accounts receivable Inventory Prepaid rent Accounts payable Income tax payable $1,100,000 610,000 55,000 45,000 PEACH COMPUTER Selected Balance Sheet Data December 31 2024 $107,000 45,500 80,000 3,500 50,000 5,500 2023 $87,500 51,500 57,500 6,000 39,500 12,500 $1,925,000 1,810,000 $115,000 Increase (I) or Decrease (D) $19,500 (I) (D) 6,000 22,500 (I 2,500 (D) 10,500 (I) 7,000 (D)arrow_forward
- Wayman Corporation reports the following amounts in its December 31, 2018, income statement. $ 397,000 Income tax expense $ 51,000 Sales revenue Interest expense Salaries expense Utilities expense 21,000 Cost of goods sold 41,000 Advertising expense 51,000 131,000 31,000arrow_forwardFollowing are the income statement and some additional information for Carolina Consulting Company. Carolina Consulting Company Income Statement For the Year Ended December 31, 2021 Net sales $ 14,000 Cost of goods sold (2,300 ) Gross margin 11,700 Operating expenses $ 2,800 Depreciation expense 1,300 (4,100 ) Income before taxes 7,600 Income taxes (2,400 ) Net income $ 5,200 All sales were on credit and accounts receivable decreased by $980 in 2021 compared to 2020. Merchandise purchases were on credit with a decrease in accounts payable of $780 during the year. Ending inventory was $580 larger than beginning inventory. Income taxes payable increased $380 during the year. All operating expenses were paid for in cash. Required:Prepare the cash flows from operating activities section of the statement of cash flows using the direct method. (Amounts to be deducted should be…arrow_forwardUse the following statement of financial position and statement of comprehensive income Blue Bird, Inc. 2018 Statement of comprehensive income Net Sales Less: Cost of Goods Sold Less: Depreciation Earnings Before Interest and Taxes Less: Interest Paid Taxable Income Less: Taxes Net Income Blue Bird, Inc. Statement of financial position Years ended 2017 and 2018 $12,630 8,240 1,010 3,380 750 $2,630 920 $1,710 Cash Accounts rec. Inventory Total 2017 2018 $640 $590 1,200 1,390 2,300 2,470 $4,140 $4,450 Net fixed assets 4,640 5,200 Total assets $8,780 $9,650 Total liabilities & equity Accounts payable Long-term debt Common stock Retained earnings 2017 2018 2,500 2,800 4,000 4,500 1,040 1,690 $8,780 $9,650 Blue Bird, Inc. has 1,500 shares of stock outstanding. The price-earnings ratio for 2018 is 21. What is the market price per share of stock?arrow_forward
- Use the following information to answer this question. Windswept, Inc. 2017 Income Statement ($ in millions) Net sales Cost of goods sold Depreciation Earnings before interest and taxes Interest paid Taxable income Taxes Net income Cash Accounts rec.. Inventory Total Net fixed assets Total assets $11,400 8,150 440 $ 2,810 108 $ 2,702 946 $1,756 Windswept, Inc. 2016 and 2017 Balance Sheets ($ in millions) 2016 2017 $ 320 $ 350 What is the equity multiplier for 2017? Accounts payable 1,190 1,090 Long-term debt 2,120 1,805 Common stock $3,630 $3,245 Retained earnings 3,560 4,180 $7,190 $7,425 Total liab. & equity 2016 2017 $1,950 $2,022 1,110 1,393. 3,440 3,070 690 940 $7,190 $7,425arrow_forwardFixed assets. Use the data from the following financial statements in the popup window, E- What are the net fixed assets for the years 2016 and 2017? The net fixed assets for the year 2016 is $ (Round to the nearest dollar.) Data Table (Click on the following icon e in order to copy its contents into a spreadsheet.) Partial Income Statement Year Ending 2017 Sales revenue $350,000 Cost of goods sold $140,000 Fixed costs $43,000 Selling, general, and administrative expenses $28,000 Depreciation $46,000| (Click on the following icon in order to copy its contents into a spreadsheet.) Partial Balance Sheet 12/31/2016 ASSETS LIABILITIES $14,000| $16,000 Notes payable $28,000 Accounts payable Cash Accounts receivable $19,000 Inventories $48,000 Long-term debt $190,000 Fixed assets $368,000 OWNERS' EQUITY Enter your answer in the answer box and then click Check Answer. Print Done part remainingarrow_forwardUse the appropriate information from the data provided below to calculate operating income for the year ended December 31, 2014. Cost of Goods Sold 117,000 Inventory 125,000 General & Administrative Expenses 48,000 Net Cash Provided from Financing Activities 48,000 Dividends Paid 16,000 Net Sales 278,000 Selling & Marketing Expense 65,000 Interest Expense 23,000 Income Tax Expense 7,500arrow_forward
- Selected balance sheet information and the income statement for Pioneer Industries for the current year are presented below. Selected Balance Sheet Accounts Accounts Receivable Prior Year Current Year $ 24,000 $ 16,000 Inventory 32,000 35,200 Prepaid Rent 1,600 0 Accounts Payable 17,600 22,400 Salaries and Wages 3,200 4,800 Payable 04:23 Depreciation Expense Salaries Expense Income Statement Sales Revenue $ 480,000 Expenses: Cost of Goods Sold 288,000 32,000 48,000 19,200 19,200 17,600 16,000 $ 40,000 Rent Expense Insurance Expense Interest Expense Utilities Expense Net Income Required: Prepare the cash flows from operating activities section of the statement of cash flows using the indirect method. (Enter any deductions and cash outflows as a negative value.) Pioneer Industries Cash Flows from Operating Activities Adjustments to reconcile net income to net cash provided by operating activities: Changes in current assets and current liabilities: $ 0arrow_forwardThe following information relates to SE10-5 through SE10-7: (in millions) Net sales... Cost of goods sold SE10-7. Gross profit. Selling and administrative expenses Income from operations Interest expense.. EVANS & SONS, INC. Income Statement For Years Ended December 31, 2019 and 2018 Income before income taxes Income tax expense. Net income (in millions) Assets Current assets Cash and cash equivalents Accounts receivable Inventory.. Other current assets. Total current assets Property, plant, & equipment (net) Other assets. Total Assets Liabilities and Stockholders' Equity Current liabilities. Long-term liabilities. Total liabilities.. EVANS & SONS, INC. Balance Sheet December 31, 2019 and 2018 Stockholders' equity - common. Total Liabilities and Stockholders' Equity.. 2019 9,800 (5,500) 4,300 (2,800) 1,500 (300) $ 1,200 2019 100 900 500 400 2018 1,900 2,600 5,700 $10,200 9,300 (5,200) 4,100 (2,700) (220) (200) $980 $950 1,400 $ (250) 1,150 2018 300 800 650 250 2,000 2,500 5,900 $10,400…arrow_forwardSales. Costs and expenses Cost of goods sold. Operating expenses. Interest expense... Income before income taxes. Income tax expense.. Net income.. Statement of Income For the Year Ended December 31, 2020 $1,140,000 $1,700,000 364,800 37,800 1,542,600 157,400 55,090 $ 102,310 GEORGE INDUSTRIES Statement of Financial Position December 31, 2020 Total assets. Total liabilities.. Total shareholders' equity... 2020 2019 $842,110 $717,800 329,600 279,600 512,510 438,200 Calculate the Net profit margin ratio (use up to 2 decimal places and do not use a % sign)arrow_forward
arrow_back_ios
SEE MORE QUESTIONS
arrow_forward_ios
Recommended textbooks for you
- Essentials Of InvestmentsFinanceISBN:9781260013924Author:Bodie, Zvi, Kane, Alex, MARCUS, Alan J.Publisher:Mcgraw-hill Education,


 Foundations Of FinanceFinanceISBN:9780134897264Author:KEOWN, Arthur J., Martin, John D., PETTY, J. WilliamPublisher:Pearson,
 Fundamentals of Financial Management (MindTap Cou...FinanceISBN:9781337395250Author:Eugene F. Brigham, Joel F. HoustonPublisher:Cengage Learning
 Corporate Finance (The Mcgraw-hill/Irwin Series i...FinanceISBN:9780077861759Author:Stephen A. Ross Franco Modigliani Professor of Financial Economics Professor, Randolph W Westerfield Robert R. Dockson Deans Chair in Bus. Admin., Jeffrey Jaffe, Bradford D Jordan ProfessorPublisher:McGraw-Hill Education
Essentials Of Investments
Finance
ISBN:9781260013924
Author:Bodie, Zvi, Kane, Alex, MARCUS, Alan J.
Publisher:Mcgraw-hill Education,
Foundations Of Finance
Finance
ISBN:9780134897264
Author:KEOWN, Arthur J., Martin, John D., PETTY, J. William
Publisher:Pearson,
Fundamentals of Financial Management (MindTap Cou...
Finance
ISBN:9781337395250
Author:Eugene F. Brigham, Joel F. Houston
Publisher:Cengage Learning
Corporate Finance (The Mcgraw-hill/Irwin Series i...
Finance
ISBN:9780077861759
Author:Stephen A. Ross Franco Modigliani Professor of Financial Economics Professor, Randolph W Westerfield Robert R. Dockson Deans Chair in Bus. Admin., Jeffrey Jaffe, Bradford D Jordan Professor
Publisher:McGraw-Hill Education