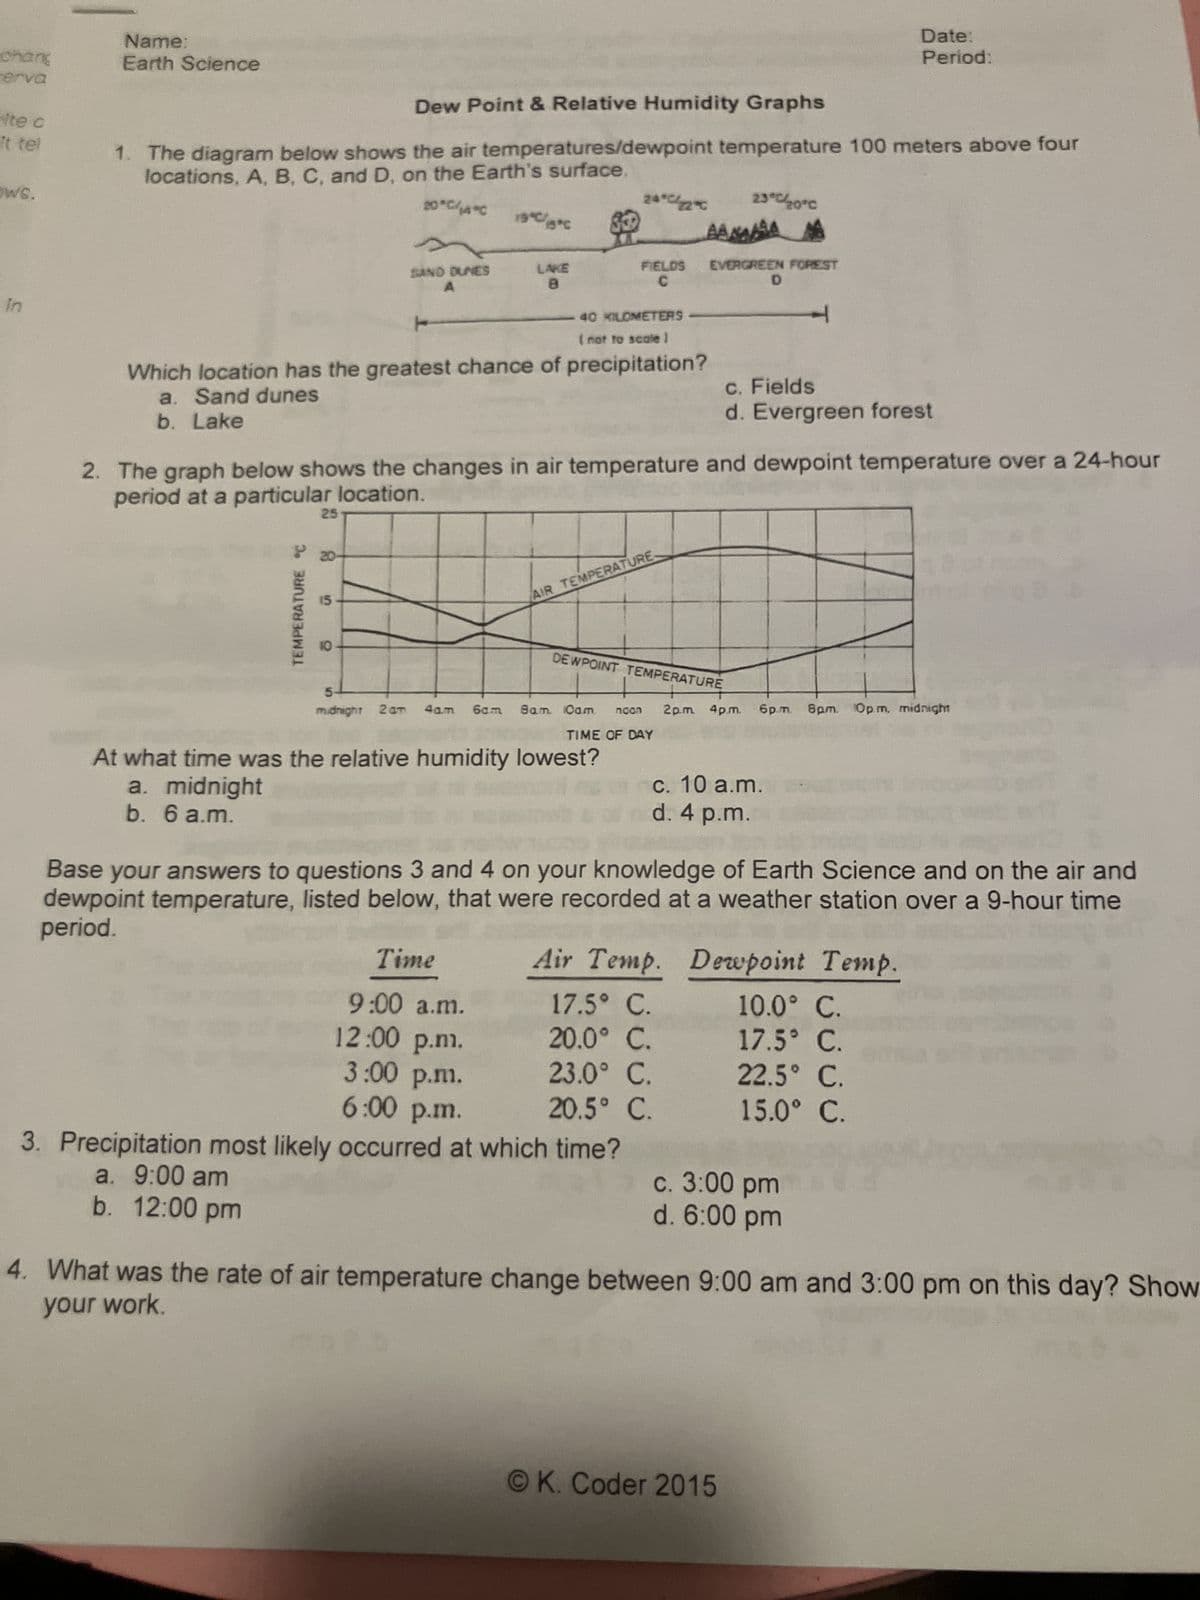
chang erva Name: Earth Science Date: Period: ite c It tel Dew Point & Relative Humidity Graphs 1. The diagram below shows the air temperatures/dewpoint temperature 100 meters above four locations, A, B, C, and D, on the Earth's surface. ws. 20°C/14°C 19°C/5*C 24°C22°C 23°C/20°C AAAA SAND DUNES A LAKE 8 FIELDS EVERGREEN FOREST C In 40 KILOMETERS (not to scale) D T Which location has the greatest chance of precipitation? a. Sand dunes b. Lake c. Fields d. Evergreen forest 2. The graph below shows the changes in air temperature and dewpoint temperature over a 24-hour period at a particular location. TEMPERATURE °C 25 20 AIR TEMPERATURE. 10 DEWPOINT TEMPERATURE 5 midnight 2am 4am 6cm 8am. Oam ncon TIME OF DAY 2p.m. 4pm. 6p.m. 8pm. Opm, midnight At what time was the relative humidity lowest? a. midnight b. 6 a.m. c. 10 a.m. d. 4 p.m. Base your answers to questions 3 and 4 on your knowledge of Earth Science and on the air and dewpoint temperature, listed below, that were recorded at a weather station over a 9-hour time period. Time Air Temp. Dewpoint Temp. 9:00 a.m. 17.5° C. 10.0° C. 12:00 p.m. 20.0° C. 17.5° C. 3:00 p.m. 23.0° C. 22.5° C. 6:00 p.m. 20.5° C. 15.0° C. 3. Precipitation most likely occurred at which time? a. 9:00 am c. 3:00 pm d. 6:00 pm b. 12:00 pm 4. What was the rate of air temperature change between 9:00 am and 3:00 pm on this day? Show your work. OK. Coder 2015
chang erva Name: Earth Science Date: Period: ite c It tel Dew Point & Relative Humidity Graphs 1. The diagram below shows the air temperatures/dewpoint temperature 100 meters above four locations, A, B, C, and D, on the Earth's surface. ws. 20°C/14°C 19°C/5*C 24°C22°C 23°C/20°C AAAA SAND DUNES A LAKE 8 FIELDS EVERGREEN FOREST C In 40 KILOMETERS (not to scale) D T Which location has the greatest chance of precipitation? a. Sand dunes b. Lake c. Fields d. Evergreen forest 2. The graph below shows the changes in air temperature and dewpoint temperature over a 24-hour period at a particular location. TEMPERATURE °C 25 20 AIR TEMPERATURE. 10 DEWPOINT TEMPERATURE 5 midnight 2am 4am 6cm 8am. Oam ncon TIME OF DAY 2p.m. 4pm. 6p.m. 8pm. Opm, midnight At what time was the relative humidity lowest? a. midnight b. 6 a.m. c. 10 a.m. d. 4 p.m. Base your answers to questions 3 and 4 on your knowledge of Earth Science and on the air and dewpoint temperature, listed below, that were recorded at a weather station over a 9-hour time period. Time Air Temp. Dewpoint Temp. 9:00 a.m. 17.5° C. 10.0° C. 12:00 p.m. 20.0° C. 17.5° C. 3:00 p.m. 23.0° C. 22.5° C. 6:00 p.m. 20.5° C. 15.0° C. 3. Precipitation most likely occurred at which time? a. 9:00 am c. 3:00 pm d. 6:00 pm b. 12:00 pm 4. What was the rate of air temperature change between 9:00 am and 3:00 pm on this day? Show your work. OK. Coder 2015

Applications and Investigations in Earth Science (9th Edition)
9th Edition
ISBN:9780134746241
Author:Edward J. Tarbuck, Frederick K. Lutgens, Dennis G. Tasa
Publisher:Edward J. Tarbuck, Frederick K. Lutgens, Dennis G. Tasa
Chapter1: The Study Of Minerals
Section: Chapter Questions
Problem 1LR

Related questions
Question
Transcribed Image Text:chang
erva
Name:
Earth Science
Date:
Period:
ite c
It tel
Dew Point & Relative Humidity Graphs
1. The diagram below shows the air temperatures/dewpoint temperature 100 meters above four
locations, A, B, C, and D, on the Earth's surface.
ws.
20°C/14°C
19°C/5*C
24°C22°C
23°C/20°C
AAAA
SAND DUNES
A
LAKE
8
FIELDS
EVERGREEN FOREST
C
In
40 KILOMETERS
(not to scale)
D
T
Which location has the greatest chance of precipitation?
a. Sand dunes
b. Lake
c. Fields
d. Evergreen forest
2. The graph below shows the changes in air temperature and dewpoint temperature over a 24-hour
period at a particular location.
TEMPERATURE °C
25
20
AIR TEMPERATURE.
10
DEWPOINT TEMPERATURE
5
midnight 2am 4am 6cm 8am. Oam ncon
TIME OF DAY
2p.m. 4pm. 6p.m. 8pm. Opm, midnight
At what time was the relative humidity lowest?
a. midnight
b. 6 a.m.
c. 10 a.m.
d. 4 p.m.
Base your answers to questions 3 and 4 on your knowledge of Earth Science and on the air and
dewpoint temperature, listed below, that were recorded at a weather station over a 9-hour time
period.
Time
Air Temp.
Dewpoint Temp.
9:00 a.m.
17.5° C.
10.0° C.
12:00 p.m.
20.0° C.
17.5° C.
3:00 p.m.
23.0° C.
22.5° C.
6:00 p.m.
20.5° C.
15.0° C.
3. Precipitation most likely occurred at which time?
a. 9:00 am
c. 3:00 pm
d. 6:00 pm
b. 12:00 pm
4. What was the rate of air temperature change between 9:00 am and 3:00 pm on this day? Show
your work.
OK. Coder 2015
Expert Solution
This question has been solved!
Explore an expertly crafted, step-by-step solution for a thorough understanding of key concepts.

This is a popular solution!

Trending now
This is a popular solution!

Step by step
Solved in 2 steps

Recommended textbooks for you
Applications and Investigations in Earth Science …
Earth Science
ISBN:
9780134746241
Author:
Edward J. Tarbuck, Frederick K. Lutgens, Dennis G. Tasa
Publisher:
PEARSON

Exercises for Weather & Climate (9th Edition)
Earth Science
ISBN:
9780134041360
Author:
Greg Carbone
Publisher:
PEARSON

Environmental Science
Earth Science
ISBN:
9781260153125
Author:
William P Cunningham Prof., Mary Ann Cunningham Professor
Publisher:
McGraw-Hill Education
Applications and Investigations in Earth Science …
Earth Science
ISBN:
9780134746241
Author:
Edward J. Tarbuck, Frederick K. Lutgens, Dennis G. Tasa
Publisher:
PEARSON
Exercises for Weather & Climate (9th Edition)
Earth Science
ISBN:
9780134041360
Author:
Greg Carbone
Publisher:
PEARSON
Environmental Science
Earth Science
ISBN:
9781260153125
Author:
William P Cunningham Prof., Mary Ann Cunningham Professor
Publisher:
McGraw-Hill Education

Earth Science (15th Edition)
Earth Science
ISBN:
9780134543536
Author:
Edward J. Tarbuck, Frederick K. Lutgens, Dennis G. Tasa
Publisher:
PEARSON

Environmental Science (MindTap Course List)
Earth Science
ISBN:
9781337569613
Author:
G. Tyler Miller, Scott Spoolman
Publisher:
Cengage Learning

Physical Geology
Earth Science
ISBN:
9781259916823
Author:
Plummer, Charles C., CARLSON, Diane H., Hammersley, Lisa
Publisher:
Mcgraw-hill Education,