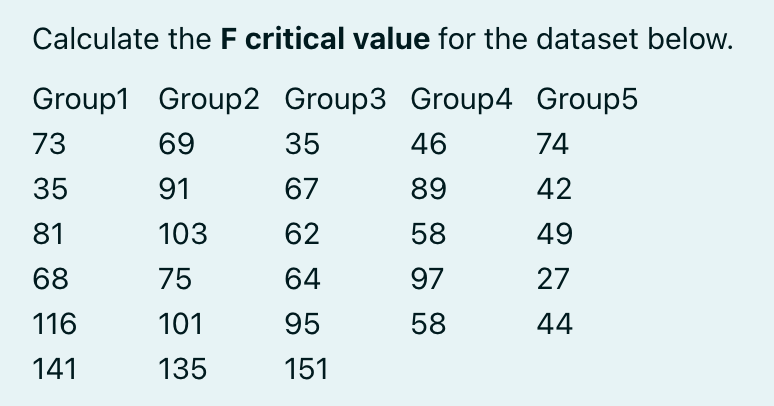
Calculate the F critical value for the dataset below. Group1 Group2 Group3 Group 4 Group5 73 69 35 46 74 35 91 67 89 42 81 103 62 58 49 68 75 64 97 27 116 101 95 58 44 141 135 151


Q: Jorgenson Corporation has provided the following data for the first five months of the year: Machine…
A: The data set for the machine hours and lubrication cost is given belowMachine Hours(X)Lubrication…
Q: Find the area under the curve that appears greater than Z - score Z =0.18
A: Here we need to find the area under the curve that appears greater than Z-score Z = 0.18
Q: a. Which of the following graphs is correct? O A. -1.69 1.09 Z O B. OC. ○ D. Q Q Q Q Q z G ㄑ吧 ZG…
A: The given z-scores are -1.69 and 1.09.
Q: Test the hypothesis that the average content of containers of a particular lubricant is 10 liters if…
A: The question is about hypothesis testing.Given :Population mean content of containers of a…
Q: You have estimated the following AR(1) model: x=0.3+0.7x+ε, What are E(x) and E(x, x) given you know…
A: The AR(1) model is given as follows:.
Q: Compute the coefficients b₁ and b₂ for the regression a. rx,y=0.80, rx2y=0.60, rx₁x2 b. x₁y = -0.80,…
A: The regression model Here we want to find the coefficients b1 and b2
Q: Suppose Z follows the standard normal distribution. Use the calculator provided, or this table, to…
A: From the provided information,
Q: data given below represent the number of males and females in a work group who feel overstressed and…
A: By applying the chi-square test for independence,Observed frequency (O)…
Q: Solve the given problem. A university counselor believes that hypnosis is more effective than the…
A: It is believed by the University counselor that hypnosis is more effective than the standard…
Q: What is the variance for the following set of scores: 2, 2, 2, 2, 2. A. 0 B. 2 C. 4 D. 25
A: We have given a data set-2, 2, 2, 2, 2We have to find the variance.
Q: Is the estimated regression slope from part (d) statistically significant? That is, can you reject…
A: The slope is 1.68 and standard error for slope is 0.98 and the sample size is 64.
Q: 54372 1 24442 2 Answer the following questions, providing the calculation process for each. 1.…
A:
Q: The cross-tabulation data given below show the number of people who rated a customer service…
A: The given data is as follows: Friendliness/Politeness Staff GreetingNoYesNo 126Yes1519
Q: ($1,000s) 22 ($1,000) 9.6 To the Internal Revenue Service (IRS), the reasonableness of total…
A: a)The data for the adjusted Gross income and itemized deductions is given.In this case, Adjusted…
Q: Assume that a time-series plot takes the form of that shown in the following graph: 80 60 40 40 20…
A: It is required to identify the model that would give the best fit to the given time-series plot.
Q: The time between requests to a web server is exponentially distributed with mean 0.500 seconds. 1.…
A: The objective of the question is to find the probabilities of different scenarios related to the…
Q: A manufacturer claims that the average tensile strength of thread A exceeds the average tensile…
A:
Q: Assume that when human resource managers are randomly selected, 49% say job applicants should follow…
A: Given ,49% say job applicants should follow up within two weeks .i.e, P(success) = p = 49% = 0.49If…
Q: can you do the next part of the question please
A: In order to estimate the parameters, we need to calculate the sample mean and sample variance of…
Q: In a recent study, the Centers for Disease Control reported that diastolic blood pressures of adult…
A: The objective of the question is to find the proportion of women with blood pressures lower than 70,…
Q: Data were collected from a longitudinal study designed to investigate the relationship between blood…
A: The objective of the question is to find the 98 percent confidence interval for the slope of the…
Q: A survey of 82 students found that 29% were in favor of raising tuition to pave new parking lots.…
A: no=82,σo=6.6%=0.066σn=3.7%=0.037,p=29%=0.29
Q: a. Calculate the mean wealth, д, of the six people. H= billion (Round to one decimal place as…
A: Given that information21,18,17,28,29,17 a) Mean of wealth of the six people =
Q: The proportion of adults living in a small town who are college graduates is estimated to be p =…
A: Suppose p is the true population proportion of all adults in a small town, who are college…
Q: The amount of paint required to paint a surface with an area of 50 m2 is normally distributed with…
A:
Q: Please show all working in details
A: The 97% confidence interval for the proportion of members who use the cardio machines at Bell's gym…
Q: A high school baseball player has a 0.198 batting average. In one game, he gets 9 at bats. What is…
A:
Q: A laptop company claims up to 9.1 hours of wireless web usage for its newest laptop battery life.…
A: a) 0.1788b) 0.1788c) 9.332 hoursExplanation:Question a.Step 1: List the given values. We are told…
Q: A state government plans to install solar panels on the rooftop of a government building. The…
A: Explanation:Calculate the number of solar panels needed:Number of solar panels = Total rooftop area…
Q: Only 100% sure experts solve it if u will send wrong answers I will dislike okk
A: The objective of this question is to formulate the null and alternative hypotheses and then use the…
Q: 5.47 1 Determine whether = ½½ (x-x)² or = i=1 n 1 n+1/2 (x)² has lower mean squared error when…
A:
Q: Calculate the mean of a Chi- Square distribution with 7 degrees of freedom?
A:
Q: 2. A password has to use the following format: LDDDDLLL, where L can be any of the upper case…
A: a. probability =26⋅10⋅7⋅3⋅231 b. probability =261⋅251⋅241⋅231 Explanation:To solve this…
Q: Find the indicated z score. The graph depicts the standard normal distribution with mean 0 and…
A: For the normal distribution curve,
Q: Calculate the F critical value for the dataset below. Group1 Group2 Group3 Group4 Group5 69 77 36 45…
A: From the provided information,Number of groups (k) = 5Total sample size with all groups (N) = 28
Q: You are conducting a study to see if the probability of catching the flu this year is significantly…
A: Claim : the probability of catching the flu this year is significantly more than 31%Test statistic :…
Q: Assume that the random variable X is normally distributed, with mean = 50 and standard deviation σ =…
A: The mean and standard deviation of random variable X are 50 and 11 respectively.
Q: Please give me answer of this question immediately
A: Refer the explanation part for the solutionExplanation:Step 1:Existing records give sample…
Q: - - - 1. By far, the majority of the world's water is salt water. 2. The pie graph represents 50…
A: In the given pie chart we can deduce the infomation that 97% of the water is liquid salt water in…
Q: A random sample of 100 automobile owners in a region shows that an automobile is driven on average…
A: A random sample of 0 automobile owners in a region shows that an automobile is driven on average…
Q: Many random number generators allow users to specify the range of the random numbers to be produced.…
A: In this case, the random variable is Y that takes any value between 0 and 3.It is needed to compute…
Q: The number of traffic accidents at a certain intersection is thought to be well modeled by a Poisson…
A: The objective of the question is to find various probabilities and statistics related to the waiting…
Q: 30 27 9.6 32 10.1 48 11.1 65 13.5 85 15.7 To the Internal Revenue Service (IRS), the reasonableness…
A: The given data is as follows: Adjusted Gross Income ($1,000s)Itemized Deductions…
Q: In a standard golf tournament, golfers play 18 holes of golf on each of 4 consecutive days. For each…
A: The box plot is a graphical representation of data in five number summary method.The box plot of…
Q: ndard deviation of 0.010 ounces. A case consists of 24 bottles randomly sampled from the output of…
A: n=24,μx=24.01,σx=0.01Note: According to bartelby question answer guidelines an expert can solve only…
Q: You are conducting a study to see if the proportion of voters who prefer Candidate A is…
A: P = proportion of voters who prefer candidate AClaim : p>0.81Test statistic : z = 2.845P value =…
Q: Two fair dice are rolled 5 times. Let the random variable represent the number of times that the sum…
A: Since you have asked multiple questions, we will solve the first question for you. If you want any…
Q: Suppose a customer gets 6 questions correct in the quiz. The [Select] hypothesis for a statistical…
A: Given that,No. of multiple choice question The probability that the answer is correct
Q: A discrete random variable x follows uniform distribution and takes the values 6, 8,10, 12, 18. The…
A:
Q: 12-7. Suppose X1, X2, four ordinary moments ... is an IID sequence of random variables, having α₁ =…
A: denotes the IID sequence of random variables having ordinary moments. needs to be defined and,For…

Step by step
Solved in 3 steps with 7 images

- Calculate the F critical value for the dataset below. Group1 Group2 Group3 Group4 Group5 73 69 35 46 74 35 91 67 89 42 81 103 62 58 49 68 75 64 97 27 116 101 95 58 44 141 135 151Obtain the Z scores on each subject’s age. DATA Subject Gender Marital Status Age Education Household Income Personal Income 1 F 1 30 0 70000.00 40000.00 2 F 0 40 0 32500.00 32500.00 3 M 1 45 0 42000.00 .0 4 M 1 23 0 50000.00 50000.00 5 M 0 50 0 4500.00 4500.00 6 F 0 65 1 40000.00 22000.00 7 F 1 33 1 12000.00 12000.00 8 F 0 20 2 56000.00 52000.00 9 F missing 30 3 17500.00 17500.00 10 M 1 Missing 4 44000.00 39000.00 11 M 2 58 1 missing missing 12 M 2 32 2 10000.00 10000.00 13 M 1 35 3 missing missing 14 F 2 23 4 100000.00 50000.00 15 F 2 34 1 64000.00 64000.00 16 M 1 26 2 Missing missing 17 M 1 36 3 missing missing 18 F 0 41 4 7500.00 5500.00 19 F 0 43 1 missing missing…Collected data: GPA of working students (working 20 hours and more per week): 2.02 2.12 2.17 2.31 2.34 2.41 2.57 2.68 2.75 2.92 2.92 2.97 2.98 3.07 3.19 3.27 3.29 3.31 3.33 3.38 3.38 3.45 3.49 3.51 3.52 3.52 3.57 3.57 3.59 3.67 Find the following: Kurtosis skewness Range
- Given the data, provide the mean accuracy for the first 10% and first 20% of the data selected for a cumulative gain curve, or lift curve, for the particular classifier. Percent of instances Accuracy Confidence 0.05 0.95 0.983 0.05 0.93 0.971 0.05 0.92 0.979 0.05 0.90 0.953 0.05 0.88 0.955 0.05 0.86 0.927Calculate t for the comparison of the mean for CA with the mean for CB. CA CB CC CD 4 6 8 9 5 7 9 9 8 9 10 10 7 7 9 10 5 7 9 8 6 7 7 9 7 9 10 11 3 5 6 7 5 4 7 7 6 7 9 10Compare the heights between these two groups. Report the t statistic and the p-value for your calculation and interpret (are these two groups significantly different from each other? character height in inches:1387471717570655362780536636968370727873727546 Actor height in inches:73717165697364747472717066818270757566677352
- Refer to the accompanying data display that results from a sample of airport data speeds in Mbps. Complete parts (a) through (c) below. t Distribution: Critical t Values Area in One Tail 0.0050.010.0250.050.10 Area in Two Tails Degrees of Freedom0.010.020.050.100.20 163.65731.82112.7066.3143.078 29.9256.9654.3032.9201.886 35.8414.5413.1822.3531.638 44.6043.7472.7762.1321.533 54.0323.3652.5712.0151.476 63.7073.1432.4471.9431.440 73.4992.9982.3651.8951.415 83.3552.8962.3061.8601.397 93.2502.8212.2621.8331.383 103.1692.7642.2281.8121.372 113.1062.7182.2011.7961.363 123.0552.6812.1791.7821.356 133.0122.6502.1601.7711.350 142.9772.6242.1451.7611.345 152.9472.6022.1311.7531.341 162.9212.5832.1201.7461.337 172.8982.5672.1101.7401.333 182.8782.5522.1011.7341.330 192.8612.5392.0931.7291.328 202.8452.5282.0861.7251.325 212.8312.5182.0801.7211.323 222.8192.5082.0741.7171.321 232.8072.5002.0691.7141.319 242.7972.4922.0641.7111.318 252.7872.4852.0601.7081.316 262.7792.4792.0561.7061.315…Because of high tuition costs at state and private universities, enrollments atcommunity colleges have increased dramatically in recent years. The following data show theenrollment (in thousands) for Jefferson Community College from 2001–2009:Year Period (t) Enrollment (1000s)2001 1 6.52002 2 8.12003 3 8.42004 4 10.22005 5 12.52006 6 13.32007 7 13.72008 8 17.22009 9 18.1Compute F10: the Forecast for 2010. Compute Pearson’s Correlation Coefficient Use the Method of Least Squares to obtain the Best-Fit-Line for this data. Use the line to compute the forecast.Create a histogram, and calculate x¯, the t-statistic, and the p-value. 34.0061858721506 43.35896389969 39.2839458791993 48.4458681201553 43.9450376906617 44.3387907086577 44.0113338310526 44.9349276905495 27.4460079151864 31.5475137945693 40.851809319706 54.4966548260204 51.2229130445186 26.5667263573046 43.8747602252099 63.6514039032307 46.348491340219 31.7043433858887 33.9291676728001 49.3914751882054 36.2727146960179 31.0702840945887 33.8717919763544 32.9018127450965 33.6820267911461 49.6234046401715 40.8105029866781 42.6603252306697 27.5886944329444 39.1727797888278 40.7544541502815 44.9921116882115 43.3559037906838 33.6109629249073 43.8720459237639 40.3090815090413 36.4897166851498 39.1530820200686 26.6401872184746 25.2436988903622 31.4427288953716 52.3131712579967 29.7246790933448 23.0352128112797 35.1500272627508 37.334025417453 29.509275714123 41.1197982416905 38.8772032697829…
- In the Heartatk dataset, what type of data is the variable Diagnosis? A. qualitative B. continuous C. discrete D. binaryA researcher collects data that represents the average number of hours of sleep in the last two nights by 8 depressed patients and 9 non-depressed patients. The researcher is interested in whether the two groups reliably differ in the amount of sleep they get. Use Jamovi to calculate t-obt and the p value.Using the data below, calculate the covariance of these samples. (calculate to 2 decimal places) seed_mass seedling_height 5.97 6.23 5.65 7.28 6.32 6.11 6.43 5.28 4.32 7.49 6.39 5.11 4.99 7.08 6.23 5.31 4.66 6.62 6.13 6.25
