Glencoe Algebra 1, Student Edition, 9780079039897, 0079039898, 2018
18th Edition
ISBN: 9780079039897
Author: Carter
Publisher: McGraw Hill
expand_more
expand_more
format_list_bulleted
Question

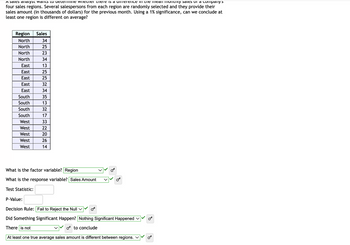
Transcribed Image Text:A Sales analyst wants to determine whether there is a umerence in the mean mommy sales of a company's
four sales regions. Several salespersons from each region are randomly selected and they provide their
sales amount (in thousands of dollars) for the previous month. Using a 1% significance, can we conclude at
least one region is different on average?
Region Sales
North
North
North
North
East
East
East
East
East
South
South
South
South
West
West
West
West
West
34
25
23
34
13
EEEEEEEEE
25
25
32
34
35
13
32
17
33
22
NIS
20
26
14
What is the factor variable? Region
What is the response variable? Sales Amount
Test Statistic:
OF
P-Value:
Decision Rule: Fail to Reject the Null
Did Something Significant Happen? Nothing Significant Happened
There is not
O to conclude
At least one true average sales amount is different between regions. ✓
Expert Solution
This question has been solved!
Explore an expertly crafted, step-by-step solution for a thorough understanding of key concepts.
Step by stepSolved in 2 steps with 1 images

Knowledge Booster
Recommended textbooks for you
 Glencoe Algebra 1, Student Edition, 9780079039897...AlgebraISBN:9780079039897Author:CarterPublisher:McGraw Hill
 Big Ideas Math A Bridge To Success Algebra 1: Stu...AlgebraISBN:9781680331141Author:HOUGHTON MIFFLIN HARCOURTPublisher:Houghton Mifflin Harcourt
 Holt Mcdougal Larson Pre-algebra: Student Edition...AlgebraISBN:9780547587776Author:HOLT MCDOUGALPublisher:HOLT MCDOUGAL

Glencoe Algebra 1, Student Edition, 9780079039897...
Algebra
ISBN:9780079039897
Author:Carter
Publisher:McGraw Hill

Big Ideas Math A Bridge To Success Algebra 1: Stu...
Algebra
ISBN:9781680331141
Author:HOUGHTON MIFFLIN HARCOURT
Publisher:Houghton Mifflin Harcourt

Holt Mcdougal Larson Pre-algebra: Student Edition...
Algebra
ISBN:9780547587776
Author:HOLT MCDOUGAL
Publisher:HOLT MCDOUGAL
