MATLAB: An Introduction with Applications
6th Edition
ISBN: 9781119256830
Author: Amos Gilat
Publisher: John Wiley & Sons Inc
expand_more
expand_more
format_list_bulleted
Question

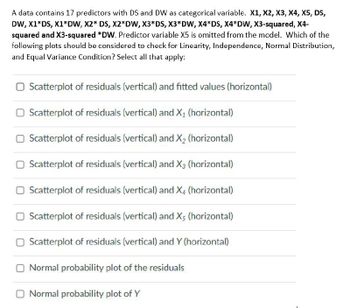
Transcribed Image Text:A data contains 17 predictors with DS and DW as categorical variable. X1, X2, X3, X4, X5, DS,
DW, X1*DS, X1*DW, X2* DS, X2*DW, X3*DS, X3*DW, X4*DS, X4*DW, X3-squared, X4-
squared and X3-squared *DW. Predictor variable X5 is omitted from the model. Which of the
following plots should be considered to check for Linearity, Independence, Normal Distribution,
and Equal Variance Condition? Select all that apply:
☐ Scatterplot of residuals (vertical) and fitted values (horizontal)
☐ Scatterplot of residuals (vertical) and X₁ (horizontal)
☐ Scatterplot of residuals (vertical) and X2 (horizontal)
Scatterplot of residuals (vertical) and X3 (horizontal)
☐ Scatterplot of residuals (vertical) and X4 (horizontal)
☐ Scatterplot of residuals (vertical) and X5 (horizontal)
☐ Scatterplot of residuals (vertical) and Y (horizontal)
☐ Normal probability plot of the residuals
Normal probability plot of Y
Expert Solution
This question has been solved!
Explore an expertly crafted, step-by-step solution for a thorough understanding of key concepts.
Step by stepSolved in 2 steps

Knowledge Booster
Similar questions
- 3 Which scenario would most likely show a negative association between the variables? A the height of a tree, x, and the amount of time it takes to climb to the top of the tree, y B the number of people in the mall, x, and the number of cars in the parking lot, y miles traveled in a car, z, and the amount of gasoline used, y D time spent reading a book, r, and the number of pages left to read, yarrow_forwardHow to find independent and defendant variablesarrow_forwardSuppose you have access to a database with the variables listed below. Choose two variables you are interested in exploring that may be related (a predictor and outcome). Which variable is your y (outcome) and which is your x (predictor)? *Hint: which one may predict the other? Example: hot weather may predict sunburns.arrow_forward
- True or false Interaction occurs when the relationship between an independent variable and a dependent variable is affected by another independent variablearrow_forwardExplain the difference between Independent and Dependent Variables.arrow_forwardIndicate the dependent and independent variables, the number of levels for each independent variable, and whether each variable is within-subjects or between subjects 1. Individuals with anorexia and individuals with bulimia take a cognitive distortions test upon entering a treatment program for eating disorders and again three weeks later.arrow_forward
arrow_back_ios
arrow_forward_ios
Recommended textbooks for you
 MATLAB: An Introduction with ApplicationsStatisticsISBN:9781119256830Author:Amos GilatPublisher:John Wiley & Sons Inc
 Probability and Statistics for Engineering and th...StatisticsISBN:9781305251809Author:Jay L. DevorePublisher:Cengage Learning
 Statistics for The Behavioral Sciences (MindTap C...StatisticsISBN:9781305504912Author:Frederick J Gravetter, Larry B. WallnauPublisher:Cengage Learning
 Elementary Statistics: Picturing the World (7th E...StatisticsISBN:9780134683416Author:Ron Larson, Betsy FarberPublisher:PEARSON
 The Basic Practice of StatisticsStatisticsISBN:9781319042578Author:David S. Moore, William I. Notz, Michael A. FlignerPublisher:W. H. Freeman
 Introduction to the Practice of StatisticsStatisticsISBN:9781319013387Author:David S. Moore, George P. McCabe, Bruce A. CraigPublisher:W. H. Freeman

MATLAB: An Introduction with Applications
Statistics
ISBN:9781119256830
Author:Amos Gilat
Publisher:John Wiley & Sons Inc

Probability and Statistics for Engineering and th...
Statistics
ISBN:9781305251809
Author:Jay L. Devore
Publisher:Cengage Learning

Statistics for The Behavioral Sciences (MindTap C...
Statistics
ISBN:9781305504912
Author:Frederick J Gravetter, Larry B. Wallnau
Publisher:Cengage Learning

Elementary Statistics: Picturing the World (7th E...
Statistics
ISBN:9780134683416
Author:Ron Larson, Betsy Farber
Publisher:PEARSON

The Basic Practice of Statistics
Statistics
ISBN:9781319042578
Author:David S. Moore, William I. Notz, Michael A. Fligner
Publisher:W. H. Freeman

Introduction to the Practice of Statistics
Statistics
ISBN:9781319013387
Author:David S. Moore, George P. McCabe, Bruce A. Craig
Publisher:W. H. Freeman