A: Create a spreadsheet that calculates the costs of shipping to Portland and Riverside by pallets based on the frequency distribution used in the histograms used in Milestone One. (Link the cost data to the data in the Costs&Distances tab.) State the rationale you used. Size of Shipment Tranport cost Cost per Pallet -requency Cost of Shipments Size of Shipment Tranport cost Cost per Pallet Frequency Cost of Shipments 6 12 18 24 48 72 3 6 12 18 24 48 72 F: Create shipment histograms for Portland and Riverside From "Data" tab, filter and sort data by Destination name in A-Z order. Select Portland. Next, click on the Data Analysis ribbon, select Histogram and then choose desired Input Range (entire range of Pallets for Portland) and Bin Range (similar to cells B66 to 873 in this tab), then click OK to plot histogram shown below Portland Bin Frequency 1 15 3 19 6 0 12 21 18 0 24 26 48 12 72 6 0 More Repeat this time for Riverside Riverside Bin Frequency 1 12 3 12 6 0 12 0 18 0 24 58 48 23 72 0 More 0 Frequency Frequency 22° 60 ° Histogram 1 3 #6 12 6 12 18 24 48 72 More 18 ■24 12 Histogram 1 #3 #6 ■12 18 24 48 72 More 18 Bin ■24
A: Create a spreadsheet that calculates the costs of shipping to Portland and Riverside by pallets based on the frequency distribution used in the histograms used in Milestone One. (Link the cost data to the data in the Costs&Distances tab.) State the rationale you used. Size of Shipment Tranport cost Cost per Pallet -requency Cost of Shipments Size of Shipment Tranport cost Cost per Pallet Frequency Cost of Shipments 6 12 18 24 48 72 3 6 12 18 24 48 72 F: Create shipment histograms for Portland and Riverside From "Data" tab, filter and sort data by Destination name in A-Z order. Select Portland. Next, click on the Data Analysis ribbon, select Histogram and then choose desired Input Range (entire range of Pallets for Portland) and Bin Range (similar to cells B66 to 873 in this tab), then click OK to plot histogram shown below Portland Bin Frequency 1 15 3 19 6 0 12 21 18 0 24 26 48 12 72 6 0 More Repeat this time for Riverside Riverside Bin Frequency 1 12 3 12 6 0 12 0 18 0 24 58 48 23 72 0 More 0 Frequency Frequency 22° 60 ° Histogram 1 3 #6 12 6 12 18 24 48 72 More 18 ■24 12 Histogram 1 #3 #6 ■12 18 24 48 72 More 18 Bin ■24

Related questions
Question
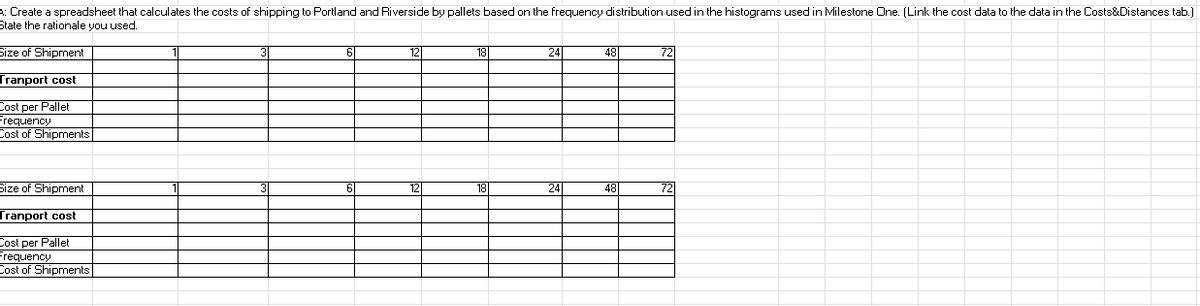
Transcribed Image Text:A: Create a spreadsheet that calculates the costs of shipping to Portland and Riverside by pallets based on the frequency distribution used in the histograms used in Milestone One. (Link the cost data to the data in the Costs&Distances tab.)
State the rationale you used.
Size of Shipment
Tranport cost
Cost per Pallet
-requency
Cost of Shipments
Size of Shipment
Tranport cost
Cost per Pallet
Frequency
Cost of Shipments
6
12
18
24
48
72
3
6
12
18
24
48
72
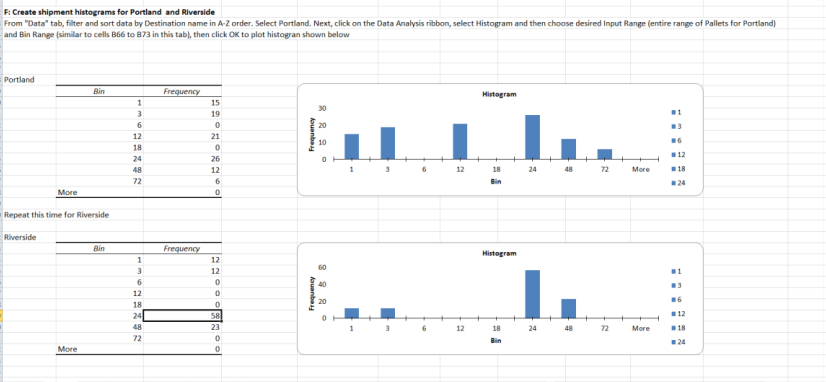
Transcribed Image Text:F: Create shipment histograms for Portland and Riverside
From "Data" tab, filter and sort data by Destination name in A-Z order. Select Portland. Next, click on the Data Analysis ribbon, select Histogram and then choose desired Input Range (entire range of Pallets for Portland)
and Bin Range (similar to cells B66 to 873 in this tab), then click OK to plot histogram shown below
Portland
Bin
Frequency
1
15
3
19
6
0
12
21
18
0
24
26
48
12
72
6
0
More
Repeat this time for Riverside
Riverside
Bin
Frequency
1
12
3
12
6
0
12
0
18
0
24
58
48
23
72
0
More
0
Frequency
Frequency
22°
60
°
Histogram
1
3
#6
12
6
12
18
24
48
72
More
18
■24
12
Histogram
1
#3
#6
■12
18
24
48
72
More
18
Bin
■24
Expert Solution
This question has been solved!
Explore an expertly crafted, step-by-step solution for a thorough understanding of key concepts.

This is a popular solution!

Trending now
This is a popular solution!

Step by step
Solved in 2 steps
