MATLAB: An Introduction with Applications
6th Edition
ISBN: 9781119256830
Author: Amos Gilat
Publisher: John Wiley & Sons Inc
expand_more
expand_more
format_list_bulleted
Question

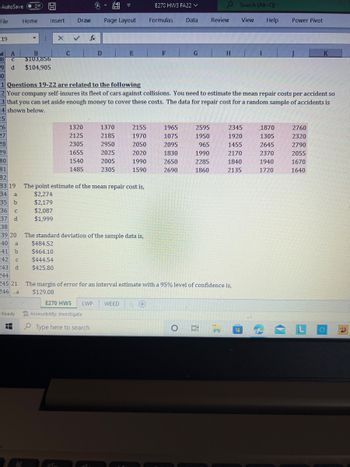
Transcribed Image Text:## Estimating Mean Repair Costs for Vehicle Collisions
### Sample Data Overview
Your company self-insures its fleet of cars against collisions. To appropriately allocate funds for potential repairs, you need to estimate the mean repair costs per accident. Below is a dataset of repair costs ($) derived from a random sample of accidents:
```
1320, 1370, 2155, 1965, 2595, 2345, 1870, 2760
2125, 2185, 1970, 1075, 1950, 1920, 1305, 2320
2305, 2095, 965, 1455, 2645, 2790
1655, 2025, 2020, 1830, 1990, 2170, 2370, 2055
1485, 2095, 2650, 2285, 1840, 1940, 1670
1590, 2690, 1860, 2135, 1720, 1640
```
### Analysis Questions
#### Question 19
**Estimate of the Mean Repair Cost**
- Possible answers:
- a. $2,274
- b. $2,179
- c. $2,087
- d. $1,999
#### Question 20
**Standard Deviation of the Sample Data**
- Possible answers:
- a. $484.52
- b. $464.10
- c. $444.54
- d. $425.80
#### Question 21
**Margin of Error for an Interval Estimate with a 95% Confidence Level**
- Possible answers:
- a. $129.08
### Discussion
To accurately manage financial reserves for collision repairs, understanding statistical measures like the mean and standard deviation is crucial. The mean provides insight into average repair costs, while the standard deviation reveals the variability in costs. The margin of error, particularly with a 95% confidence level, helps in determining the reliability of the estimated mean.
This hands-on exercise not only aids in financial planning but also enhances statistical analysis skills by interpreting real-world data.

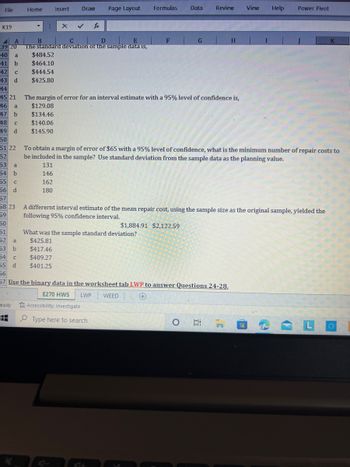
Transcribed Image Text:### Mathematical Concepts on Interval Estimates and Sample Data Analysis
#### Standard Deviation of Sample Data
To determine the standard deviation of a sample data set, the available options are:
a) $484.52
b) $464.10
c) $444.54
d) $425.80
#### Margin of Error with 95% Confidence Level
Calculating the margin of error for an interval estimate at a 95% confidence level, the potential values are:
a) $129.08
b) $134.46
c) $140.06
d) $145.90
#### Minimum Sample Size Calculation
To achieve a margin of error of $65 with a 95% confidence level, using standard deviation from the sample data as a guiding value, calculate the minimum sample size necessary. The choices are:
a) 131
b) 142
c) 162
d) 180
#### Alternative Interval Estimate of Mean Repair Cost
An alternative interval estimate of the mean repair cost, using the same sample size as the original, resulted in a 95% confidence interval of:
$1,884.91 to $2,122.59
The sample standard deviation for this interval can be:
a) $425.81
b) $417.46
c) $409.27
d) $401.25
#### Additional Instructions
Use the binary data in the worksheet tab labeled "LWP" to answer further questions, specifically Questions 24-28.
This exercise demonstrates how statistical measures such as standard deviation, margin of error, and sample size are crucial for making informed decisions based on data analysis.
Expert Solution
This question has been solved!
Explore an expertly crafted, step-by-step solution for a thorough understanding of key concepts.
Step by stepSolved in 2 steps with 2 images

Knowledge Booster
Similar questions
- I need the right answer for a and b.arrow_forward1. The maximum number of sit-ups completed by the participants in an exercise class after 1 month of the program is given below. Construct a two-stem stem and leaf plot. 24 31 54 62 36 28 55 18 27 80 37 58 32 37 41 55 39 56 42 29 35 35 2. Find the mean, median, 20% trimmed mean, first quartile, and third quartile for the data in question 3. Show your work for credit. 3. A statistics class has 20 female students and 10 male students. Average exams score for the females is 78.5 and the average exam score for the males is 72.1. What is the average exam score of the entire class?arrow_forwardThe table below shows the number of state-registered automatic weapons and the murder rate for several states in the U.S. 11.6 8.4 6.7 3.5 2.7 2.7 2.2 0.9 14.1 11.3 9.9 6.8 6.2 6.3 5.8 I = thousands of automatic weapons y = murders per 100,000 residents Keep in mind, the data in the table do not necessarily imply a direct causal link between the two variables. (In fact, can you think of any reasons why these variables may not be directly related to each other?) Also, the purpose of this question is not to make a political statement about guns or gun control. It's only to illustrate that data such as these sometimes have mathematical relationships that can be modeled with linear equations. Those relationships should always be questioned and examined carefully. With that said, these data can be modeled by the equation y = 0.87z + 3.95. Use this equation to answer the following; A) If this model is oconsistent, how many murders per 100,000 residents can be expected in a state with 8.7…arrow_forward
- Researchers wondered whether the size of a person's brain was related to the individual's mental capacity. They selected a sample of 5 females and 5 males and measured their MRI image pixel counts and IQ scores. Females Males MRI IQ MRI IG The data is reported to the right. Complete parts (a) through (d) below 139 858,472 140 955,003 935,494 924,059 1.079.550 1,001.121 Click the icon to view the critical values table. 991,305 138 141 857,782 833,868 790,619 133 135 132 141 135 140 AMRI 1,080,000- AIO 145 AIO 145- AMRI 1,080,000 780,000 130 130 780,000 130 780,000 780,000 130 1,080,000 145 1,080,000 MRI 145 MRI (b) Compute the linear correlation coefficient between MRI count and IQ. Are MRI count and IQ linearly related? Select the correct choice below and, if necessary, fill in the answer box to complete your choice. (Round to three decimal places as needed.) A. Yes, MRI count and IQ are linearly related since the linear correlation coefficient is O B. No. MRI count and IQ are not…arrow_forwardThe following refer to the following data set: 52.2 20.1 38.2 16.4 52.2 44.7 35.6 26.9 52.2 31.2 What is the arithmetic mean of this data set? mean = What is the median of this data set? median = What is the mode of this data set? mode =arrow_forward
arrow_back_ios
arrow_forward_ios
Recommended textbooks for you
 MATLAB: An Introduction with ApplicationsStatisticsISBN:9781119256830Author:Amos GilatPublisher:John Wiley & Sons Inc
 Probability and Statistics for Engineering and th...StatisticsISBN:9781305251809Author:Jay L. DevorePublisher:Cengage Learning
 Statistics for The Behavioral Sciences (MindTap C...StatisticsISBN:9781305504912Author:Frederick J Gravetter, Larry B. WallnauPublisher:Cengage Learning
 Elementary Statistics: Picturing the World (7th E...StatisticsISBN:9780134683416Author:Ron Larson, Betsy FarberPublisher:PEARSON
 The Basic Practice of StatisticsStatisticsISBN:9781319042578Author:David S. Moore, William I. Notz, Michael A. FlignerPublisher:W. H. Freeman
 Introduction to the Practice of StatisticsStatisticsISBN:9781319013387Author:David S. Moore, George P. McCabe, Bruce A. CraigPublisher:W. H. Freeman

MATLAB: An Introduction with Applications
Statistics
ISBN:9781119256830
Author:Amos Gilat
Publisher:John Wiley & Sons Inc

Probability and Statistics for Engineering and th...
Statistics
ISBN:9781305251809
Author:Jay L. Devore
Publisher:Cengage Learning

Statistics for The Behavioral Sciences (MindTap C...
Statistics
ISBN:9781305504912
Author:Frederick J Gravetter, Larry B. Wallnau
Publisher:Cengage Learning

Elementary Statistics: Picturing the World (7th E...
Statistics
ISBN:9780134683416
Author:Ron Larson, Betsy Farber
Publisher:PEARSON

The Basic Practice of Statistics
Statistics
ISBN:9781319042578
Author:David S. Moore, William I. Notz, Michael A. Fligner
Publisher:W. H. Freeman

Introduction to the Practice of Statistics
Statistics
ISBN:9781319013387
Author:David S. Moore, George P. McCabe, Bruce A. Craig
Publisher:W. H. Freeman