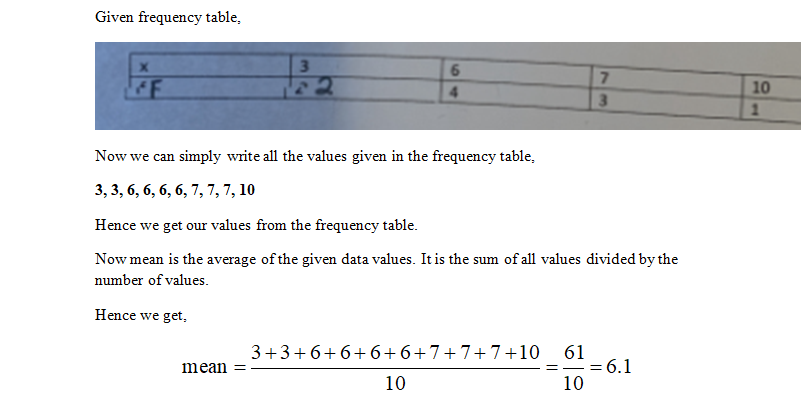
8. Find the Men, Mode and Median for A) the given frequency distribution table 6. 10 4. 3. 1
Q: 7. The number of defective parts per shipment has been tabulated in the following frequency…
A:
Q: Percentage of People Who Completed 4 or More Years of College Listed by state are the percentages of…
A: Part 1 of 4 Calculate the class width for a frequency distribution with 6 classes The highest value…
Q: The following is the frequency distribution of a sample of students from Taibah University, in…
A: Since you have posted a question with multiple subparts, we will solve first three subparts for you.…
Q: The following table gives the frequency distribution of the number of telephones owned by a sample…
A: Given,
Q: 2.) Use the following data which represents the population of the 20 most populous cities in the…
A: For the given data construct frequency distribution
Q: Percentage of People Who Completed 4 or More Years of College Listed by state are the percentages of…
A:
Q: A marketing research consultant conducted a survey of 40 persons who used to visit fast-food chains…
A: Given data:…
Q: The following data show the method of payment by 16 customers in a supermarket Here, C refers to…
A: Given, N (total customers) = 16. Frequency distributions table: b) From the above relative…
Q: (b). The following table gives the grouped frequency distribution of the crime rates in 25 different…
A: The grouped frequency distribution of crime rates in 25 different towns is given. Class limits…
Q: Percentage of People Who Completed 4 or More Years of College Listed by state are the percentages of…
A: width=range/class
Q: The following table shows the frequency of outcomes when two distinguishable coins were tossed 5,000…
A:
Q: 3. In the U.S. air pollution data are reported for 57 cities. Construct a frequency distribution and…
A:
Q: Consider the following frequency table representing the distribution of the length of a morning walk…
A: Formula to find midpoint of class is , Midpoint = Lower limit of class + upper limit of class 2
Q: 21. The frequency distribution representing the number of frequent flier miles accumulated by…
A: Frequency distribution is a recorded series of values with counts of either categorized observation…
Q: 1. COMPLETE THE FREQUENCY DISTRIBUTION TABLE 2. COMPUTE THE FOLLOWING: A) MEAN B) MEDIAN C) MODE D)…
A: Since you have posted more than one question we will solve first question for you according to our…
Q: The following data are the numbers of digits per foot in 25 guinea pigs.Construct a frequency…
A:
Q: Percentage of People Who Completed 4 or More Years of College Listed by state are the percentages of…
A: Given the data 21.4 26.0 25.3 19.3 29.5 35.0 34.7 26.1 25.8 23.4 27.1 29.2 24.5 29.5 22.1 24.3 28.8…
Q: Percentage of People Who Completed 4 or More Years of College Listed by state are the percentages of…
A: Given: Sample size n = 47 Number of classes = 5 Formula Used: Class width = Range Number of classes…
Q: Percentage of People Who Completed 4 or More Years of College Listed by state are the percentages of…
A: When data is given by a set containing the data points, then it is termed as raw data. To analysis…
Q: Percentage of People Who Completed 4 or More Years of College Listed by state are the percentages of…
A:
Q: The following table shows the frequency of outcomes when two distinguishable coins were tossed 5,000…
A: It is an important part of statistics. It is widely used.
Q: Construct a Histogram for the following frequency distribution of the heights of 100 male students…
A: Height(inches) No. of students 60-62 5 63-65 18 66-68 42 69-71 27 72-74 8
Q: The following table gives the frequency distribution of the number of errors committed by a college…
A: From given data, Number of errors(Xi) Number of games(fi) fi*xi fi* xi2 0 11 1 14 2…
Q: 9.15. Recast the following cumulative table into the form utaati ordinary frequency distribution and…
A:
Q: 30. Below is the number of hand-washing episodes 20 patients with obsessive-compulsive disorder…
A: The observations are: 21, 8, 11, 9, 12, 10, 19, 5, 9, 18, 17, 3, 6, 14, 18, 16, 19,…
Q: 1. Construct a Frequency Distribution Table of the scores of 30-students in Math 7 section Joaquin.…
A: Given, The scores of 30 students in math 7 section Joaquin. Data: Scores 8 13 18 19 21…
Q: 1.) The number of unhealthy days in selected cities are given below. Construct a Frequency…
A: For the given data, we need to construct a frequency distribution table with classes of "7" and a…
Q: The following tables given the frequency distribution of a number of peas per pea pod of 198pods.…
A:
Q: 8. A study was conducted to see how many times local college students went to the gym in the past…
A:
Q: 2. The salaries (in millions of dollars) for 31 NFL teams for a specific season are given in this…
A: 2. The frequency distribution for the salaries in class along with frequencies.
Q: The following table shows the frequency of outcomes when two distinguishable coins were tossed 4,000…
A:
Q: The following table shows the frequency of outcomes when two distinguishable coins were tossed 5,000…
A: We want to find the relative frequency distribution.
Q: Find Mean, Median and Mode of the following frequency distribution and comment on the results: Datly…
A: The frequency for a grouped data gives the number of observations lies in each class. The class…
Q: The following table shows the frequency of outcomes when two distinguishable coins were tossed 4,000…
A: The relative frequency can be calculated as R.f = frequency/Total
Q: a. Construct a relative frequency distribution table for this data. b. What proportion of employees…
A: Since we only answer up to 3 sub-parts, we’ll answer the first 3. Please resubmit the question and…
Q: 4. A sporting goods store kept a record of sales of five items for one randomly selected hour during…
A:
Q: n order to study the spending habits of shoppers in Orlando, Florida, 50 randomly selected shoppers…
A: The data set is: 4 5 0 4 2 1 1 5 3 5 4 3 4 0 5 2 5 2 0 2…
Q: 3:1. Form a frequency distribution from the following data by Inclusive Method, taking 4 as the…
A:
Q: he following are the scores obtained by BSP III-C Students on their first quiz in Psychological…
A: a) A simple frequency distribution for the given data
Q: The following table provides the frequency distributions of Vehicles prices sold Last month for a…
A: Note: Since you have posted multiple independent questions in the same request we will solve the…
Q: 2. The following table shows the distribution of number of students per teacher in 80 Colleges.…
A:
Q: 7. Consider the frequency distribution. Draw a Frequency Bar Graph. Be sure to label both axes and…
A: We are given a table of tree type and their frequency distribution.We have to draw a Frequency Bar…
Q: 4. Draw a 'less than ogive' for the following frequency distribution Marks No. of Students 0-4 4-8…
A:
Q: 1. Construct a frequency distribution for ungrouped data on the information Students in a theater…
A: The frequency distribution: The frequencies are obtained by counting how many times the value…
Q: Which statement correctly compares the shapes of the distributions? Class Sizes at East Valley HS…
A: From the given graph: For East Valley HS the data is more towards the left side and less towards…
Q: 6. Below is a frequency distribution. Classes 0-14 4. 15-29 18 30-44 12
A: (a) - Mean deviation : Mean ˉx∑fx/∑f =1649/47 =35.0851 Class(1) f(2) Mid value…
Q: 1. Construct a Frequency Distribution Table of the scores of 30-students in Math 7 section Joaquin.…
A: The given dataset is as follows 35 28 34 8 41 40 43 13 29 35 46 39 21 19 31 33 39 51 57 45 18…
Q: The following table shows the frequency of outcomes when two distinguishable coins were tossed 4,000…
A: Relative frequency of a category is calculated as the frequency of that category divided by total…
Q: 2. The following is the distribution of the percentage of students belonging to a certain minority…
A: We have given that The percentage of students belonging to a certain minority group in 40 school…
Q: 9. A study was conducted to see how many times local college students ordered fast food in the past…
A: To organise the given data by creating the frequency distribution.
Trending now
This is a popular solution!
Step by step
Solved in 2 steps with 2 images