
Concept explainers
Videos
For Exercises 1 through 20, perform each of the following steps.
a. State the hypotheses and identify the claim.
b. Find the critical value(s).
c. Compute the test value.
d. Make the decision.
e. Summarize the results.
Use the traditional method of hypothesis testing unless otherwise specified.
1. Lifetime of $1 Bills The average lifetime of circulated $1 bills is 18 months. A researcher believes that the average lifetime is not 18 months. He researched the lifetime of 50 $1 bills and found the average lifetime was 18.8 months. The population standard deviation is 2.8 months. At α = 0.02, can it be concluded that the average lifetime of a circulated $1 bill differs from 18 months?
a.
To state: The null and alternative hypotheses and identify the claim.
Answer to Problem 8.2.1RE
Null hypothesis:
Alternative hypothesis:
The claim is “the average lifetime of circulated $1 bills is not 18 months”.
Explanation of Solution
Given info:
A sample of 50 $1 bills selected and found the average lifetime was 18.8 months. The population standard deviation is 2.8 months.
Justification:
Here, the claim is that the average lifetime of circulated $1 bills is not 18 months. This can be written as
The test hypotheses are given below:
Null hypothesis: The average lifetime of circulated $1 bills is 18 months
Alternative hypothesis (claim): The average lifetime of circulated $1 bills is not 18 months.
b.
To find: The critical values.
Answer to Problem 8.2.1RE
The critical value is ±2.326.
Explanation of Solution
Calculation:
Software Procedure:
Step-by-step procedure to obtain the critical value using the MINITAB software:
- Choose Graph > Probability Distribution Plot choose View Probability > OK.
- From Distribution, choose ‘Normal’ distribution.
- Click the Shaded Area tab.
- Choose Probability Value and Both Tail for the region of the curve to shade.
- Enter the Probability value as 0.02.
- Click OK.
Output using the MINITAB software is given below:
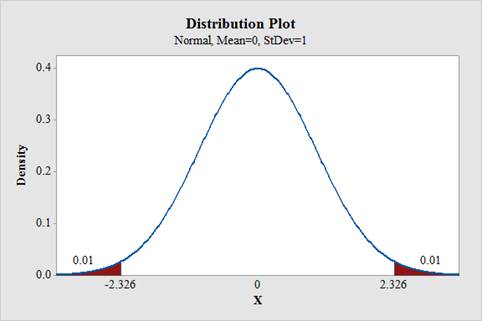
From the output, the critical value is ±2.326.
c.
To find: The test value.
Answer to Problem 8.2.1RE
The test value is 2.02.
Explanation of Solution
Calculation:
Software Procedure:
Step-by-step procedure to obtain the test value using the MINITAB software:
- Choose Stat > Basic Statistics > 1-Sample Z.
- In Summarized data, enter the sample size as 50 and mean as 18.8.
- In Standard deviation, enter 2.8.
- In Perform hypothesis test, enter the test mean as 18.
- Check Options; enter Confidence level as 98%.
- Choose not equal in alternative.
- Click OK.
Output using the MINITAB software is given below:
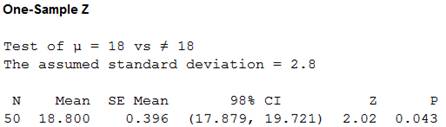
From the output, the test value is 2.02.
d.
To make: The decision.
Answer to Problem 8.2.1RE
The decision is “fail to reject the null hypothesis”.
Explanation of Solution
Calculation:
Software Procedure:
Step-by-step procedure to indicate the appropriate area and critical value using the MINITAB software:
- Choose Graph > Probability Distribution Plot choose View Probability > OK.
- From Distribution, choose ‘Normal’ distribution.
- Click the Shaded Area tab.
- Choose Probability Value and Both Tail for the region of the curve to shade.
- Enter the Probability value as 0.02.
- Enter 2.02 under show reference lines at X values.
- Click OK.
Output using the MINITAB software is given below:
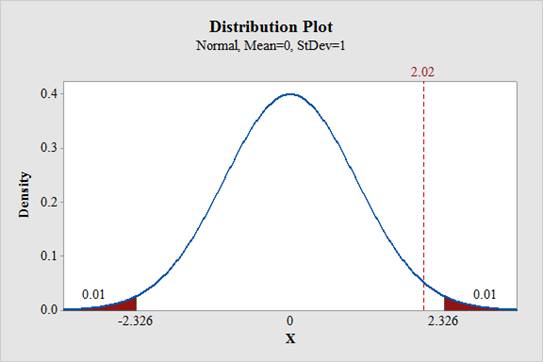
From the output, it can be observed that the test statistic value do not falls in the critical region. Therefore, the null hypothesis is not rejected.
e.
To summarize: The result.
Answer to Problem 8.2.1RE
The conclusion is that, there is no enough evidence to support the claim that the average lifetime of circulated $1 bills is not 18 months.
Explanation of Solution
Justification:
From part d, the null hypothesis is not rejected. Therefore, there is no enough evidence to support the claim that the average lifetime of circulated $1 bills is not 18 months.
Want to see more full solutions like this?
Chapter 8 Solutions
Elementary Statistics: A Step By Step Approach


 Glencoe Algebra 1, Student Edition, 9780079039897...AlgebraISBN:9780079039897Author:CarterPublisher:McGraw Hill