
Concept explainers
Videos
A sample containing years to maturity and yield (%) for 40 corporate bonds is contained in the data file named CorporateBonds (Barron’s, April 2, 2012).
- a. Develop a
scatter diagram of the data using x = years to maturity as the independent variable. Does a simple linear regression model appear to be appropriate? - b. Develop an estimated regression equation with x = years to maturity and x2 as the independent variables.
- c. As an alternative to fitting a second-order model, fit a model using the natural logarithm of price as the independent variable; that is, ŷ = b0 + b1ln(x). Does the estimated regression using the natural logarithm of x provide a better fit than the estimated regression developed in part (b)? Explain.
a.
Construct a scatter diagram of the data using
Decide whether a simple linear regression model appears to be appropriate.
Answer to Problem 29SE
The scatter diagram of the data using
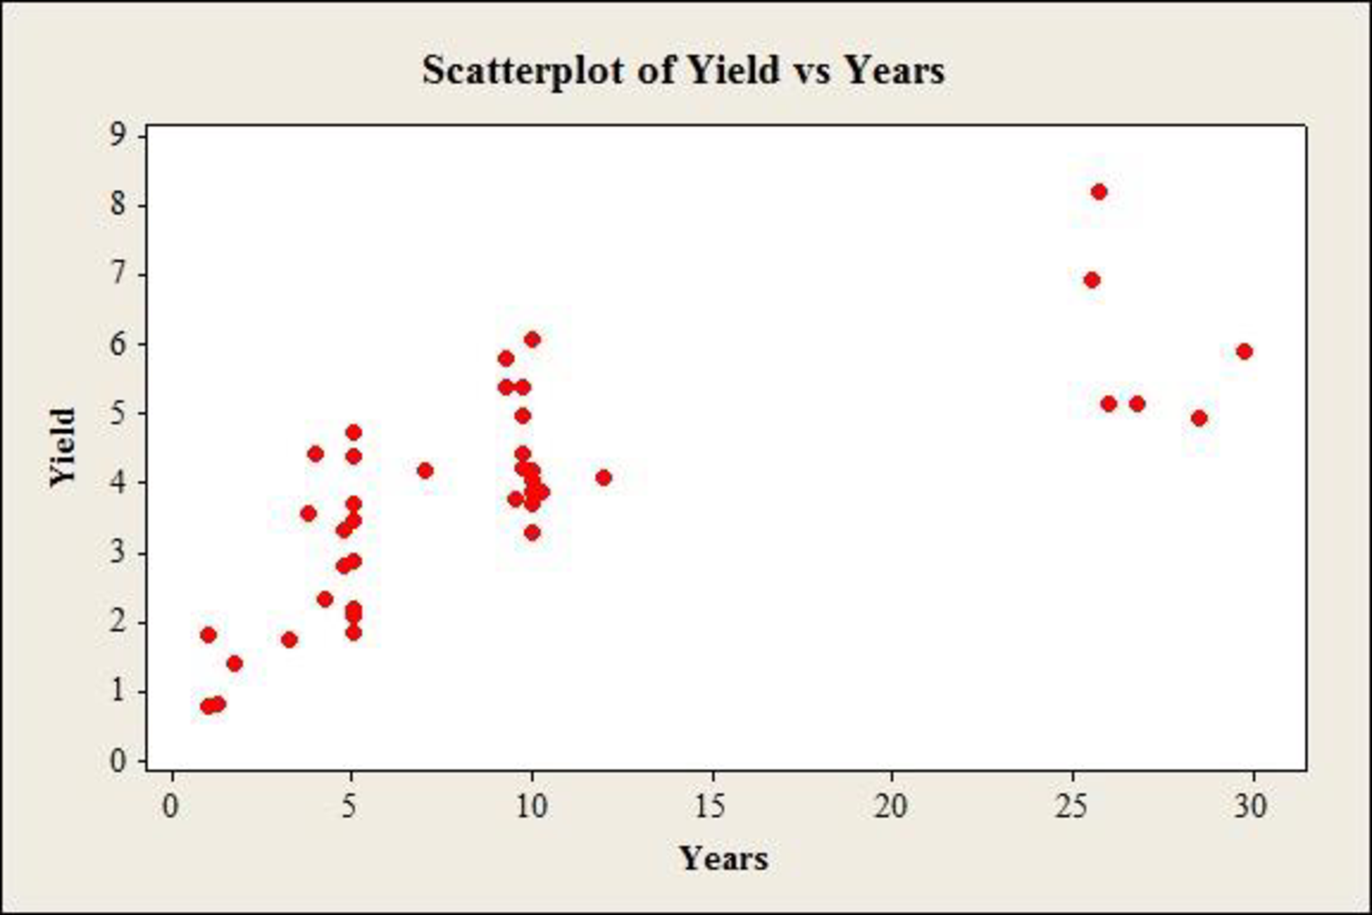
A simple linear regression model does not appear to be appropriate.
Explanation of Solution
Calculation:
The data gives information on yield (%) of 40 corporate bonds and the respective years to maturity.
Scatterplot:
Software procedure:
Step by step procedure to draw scatter diagram using MINITAB software is given below:
- Choose Graph > Scatterplot.
- Choose Simple, and then click OK.
- In Y–variables, enter the column of Yield.
- In X–variables enter the column of Years.
- Click OK.
Observation:
The scatterplot shows a gradual increase in the yield, at a decreasing rate, with increase in years up to 25. After this, there is a reduction in the values of yield. Thus, a simple linear regression model does not appear to be appropriate.
b.
Develop an estimated multiple regression equation with
Answer to Problem 29SE
The estimated multiple regression equation with
Explanation of Solution
Calculation:
Square transformation:
Software procedure:
Step by step procedure to make square transformation using MINITAB software is given as,
- Choose Calc > Calculator.
- In Store result in variable, enter YearsSq.
- In Expression, enter ‘Years’^2.
- Click OK.
The squared variable is stored in the column of ‘YearsSq’.
Regression:
Software procedure:
Step by step procedure to obtain the regression equation using MINITAB software:
- Choose Stat > Regression > General Regression.
- Under Responses, enter the column of Yield.
- Under Model, enter the columns of Years, YearsSq.
- Click OK.
Output using MINITAB software is given below:
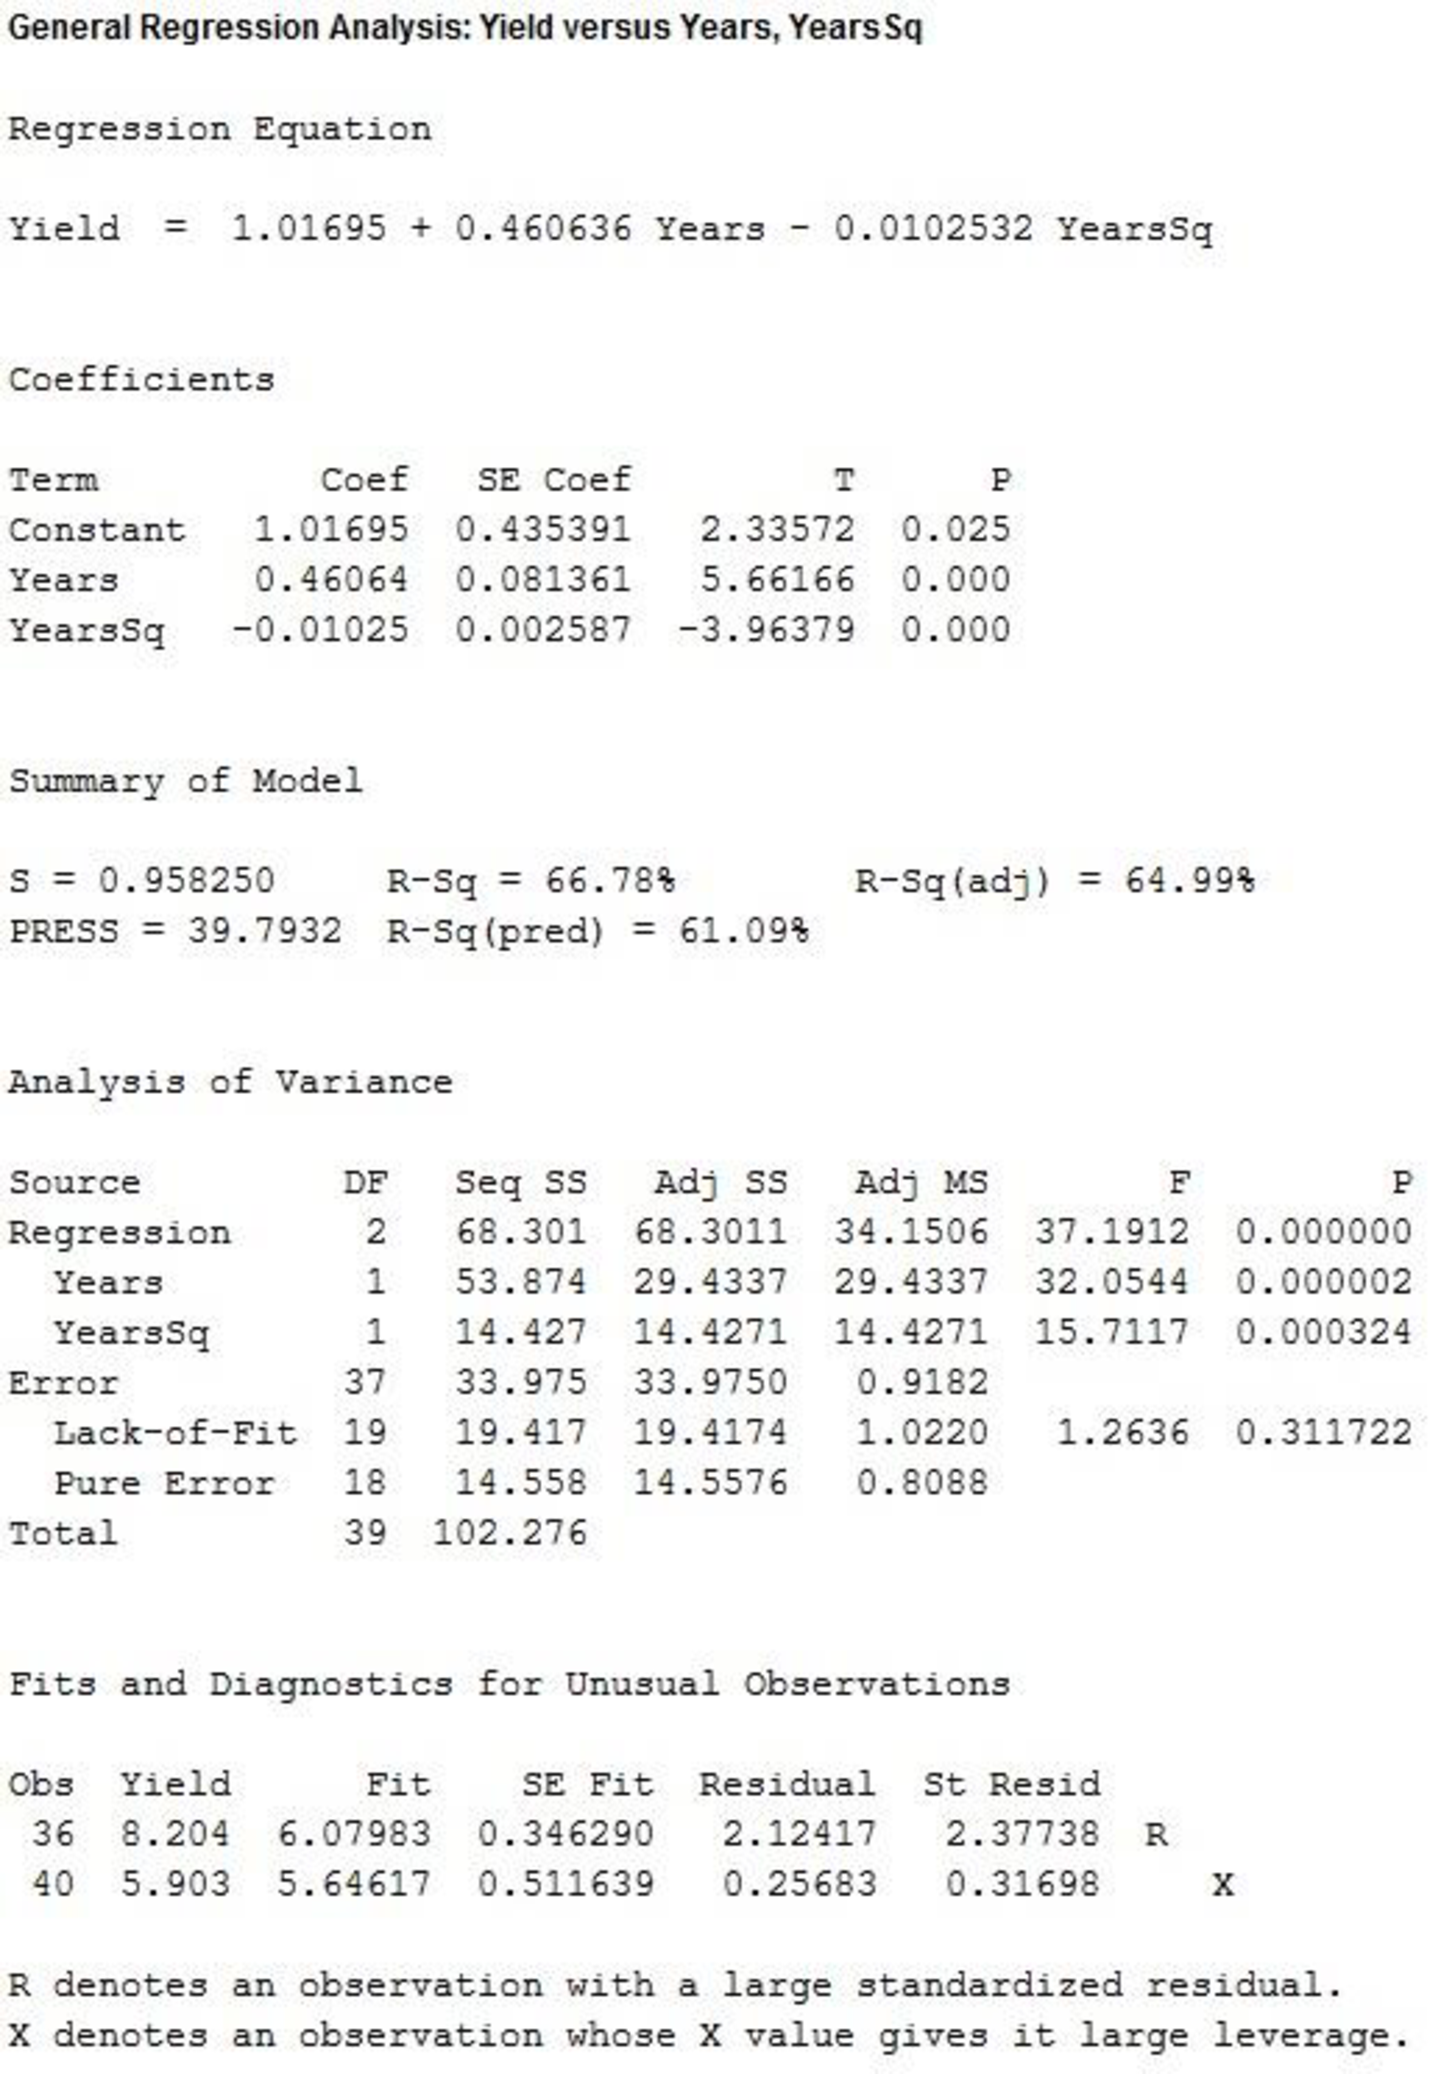
From the output, the estimated multiple regression equation with
c.
Develop an estimated multiple regression equation using the natural logarithm of years as the independent variable.
Explain whether the current regression provides a better fit than the estimated regression developed in part b.
Answer to Problem 29SE
The estimated multiple regression equation using the natural logarithm of years as the independent variable is:
The estimated regression using the natural logarithm of x provides a better fit than the estimated regression developed in part b.
Explanation of Solution
Calculation:
Logarithmic transformation:
Software procedure:
Step by step procedure to make logarithmic transformation using MINITAB software is given as,
- Choose Calc > Calculator.
- In Store result in variable, enter Years.
- In Expression, enter ln(‘Years’).
- Click OK.
The logarithm of the variable is stored in the column of ‘ln(‘Years’)’.
Regression:
Software procedure:
Step by step procedure to obtain the regression equation using MINITAB software:
- Choose Stat > Regression > General Regression.
- Under Responses, enter the column of Yield.
- Under Model, enter the columns of ln(Years).
- Click OK.
Output using MINITAB software is given below:
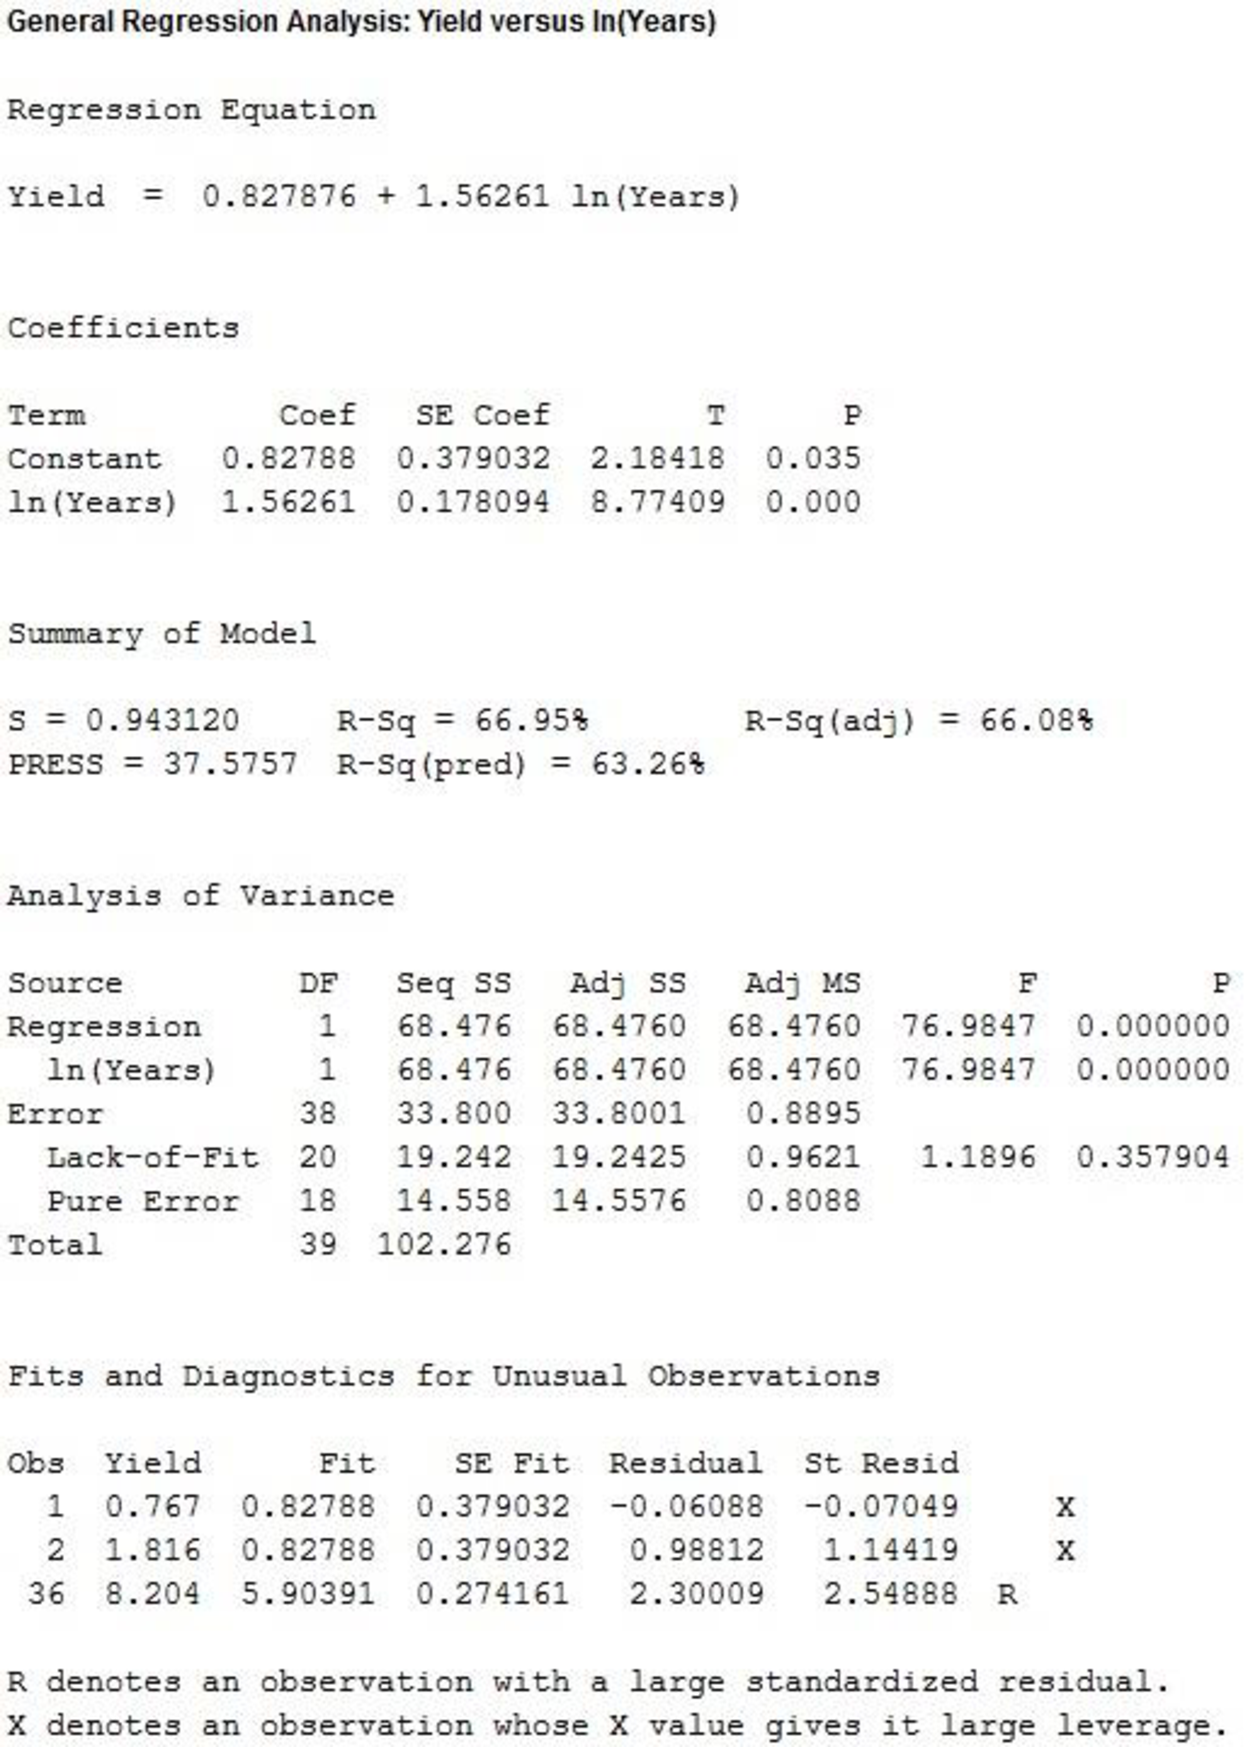
From the output, the estimated multiple regression equation using the natural logarithm of years as the independent variable is:
Adjusted-
The adjusted
The value of adjusted
The value of adjusted
Evidently, the current regression equation effectively explains more of the variation the response variable, than the second regression equation.
Thus, the estimated regression using the natural logarithm of x provides a better fit than the estimated regression developed in part b.
Want to see more full solutions like this?
Chapter 16 Solutions
STATISTICS F/BUSINESS+ECONOMICS-TEXT


- Find the equation of the regression line for the following data set. x 1 2 3 y 0 3 4arrow_forwardLife Expectancy The following table shows the average life expectancy, in years, of a child born in the given year42 Life expectancy 2005 77.6 2007 78.1 2009 78.5 2011 78.7 2013 78.8 a. Find the equation of the regression line, and explain the meaning of its slope. b. Plot the data points and the regression line. c. Explain in practical terms the meaning of the slope of the regression line. d. Based on the trend of the regression line, what do you predict as the life expectancy of a child born in 2019? e. Based on the trend of the regression line, what do you predict as the life expectancy of a child born in 1580?2300arrow_forward
 Functions and Change: A Modeling Approach to Coll...AlgebraISBN:9781337111348Author:Bruce Crauder, Benny Evans, Alan NoellPublisher:Cengage Learning
 Calculus For The Life SciencesCalculusISBN:9780321964038Author:GREENWELL, Raymond N., RITCHEY, Nathan P., Lial, Margaret L.Publisher:Pearson Addison Wesley,
 Glencoe Algebra 1, Student Edition, 9780079039897...AlgebraISBN:9780079039897Author:CarterPublisher:McGraw Hill
 Algebra & Trigonometry with Analytic GeometryAlgebraISBN:9781133382119Author:SwokowskiPublisher:Cengage
 Algebra and Trigonometry (MindTap Course List)AlgebraISBN:9781305071742Author:James Stewart, Lothar Redlin, Saleem WatsonPublisher:Cengage Learning
 Big Ideas Math A Bridge To Success Algebra 1: Stu...AlgebraISBN:9781680331141Author:HOUGHTON MIFFLIN HARCOURTPublisher:Houghton Mifflin Harcourt