
Thinking Like an Engineer: An Active Learning Approach (4th Edition)
4th Edition
ISBN: 9780134639673
Author: Elizabeth A. Stephan, David R. Bowman, William J. Park, Benjamin L. Sill, Matthew W. Ohland
Publisher: PEARSON
expand_more
expand_more
format_list_bulleted
Videos
Textbook Question
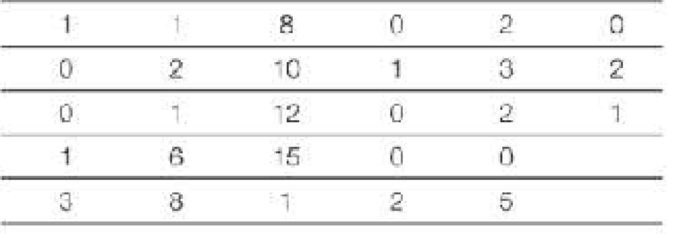
Chapter 14.1, Problem 1CC
The following table lists the number of computer chips rejected for defects during random testing over the course of a week on a manufacturing. Four samples of 20 parts are pulled each day. Use the following data to generate a histogram by hand.
Expert Solution & Answer
Want to see the full answer?
Check out a sample textbook solution
Students have asked these similar questions
Areas Under the Standard Normal Curve-The Values Were Generated Using the Standard Normal
Distribution Function of Excel
Note that the standard normal curve is symmetrical about the mean.
z
0
0.01
0.02
0.03
0.04
0.05
0.06
0.07
0.08
0.09
0.1
0.11
0.12
1
0.95
0.96
0.97
0.98
0.99
1.01
1.02
1.03
1.04
1.05
Mean - 0
1.06
1.07
1.08
1.09
A
0.0000
0.0040
0.0080
0.0120
0.0160
0.0199
0.0239
0.0279
0.0319
0.0359
0.0398
0.0438
0.0478
A
0.3186
0.3212
0.3238
0.3264
0.3289
0.3315
0.3340
0.3365
0.3389
Z
0.3413
0.3438
0.3461
0.3485
0.3508
0.3531
0.3554
0.3577
0.3599
0.3621
0.13
0.14
0.15
0.16
0.17
0.18
0.19
0.2
0.21
0.22
0.23
0.24
0.25
1.12
1.13
1.14
1.15
1.16
1.17
A
z
0.0517
0.0557
0.26
0.27
0.28
0.29
0.0596
0.0636
0.0675 0.3
0.0714 0.31
0.0753 0.32
0.0793 0.33
0.0832 0.34
0.0871 0.35
0.0910
0.0948
0.0987
1.18
1.19
1.2
1.21
1.22
1.23
1.24
1.25
1.26
1.27
1.28
A
0.3643
0.3665
0.3686
0.3708
0.3729
0.3749
0.3770
0.3790
0.3810
0.36
0.3830
0.3849
0.3869
0.3888
0.3907
0.3925
0.3944
0.3962
0.3980
0.3997
0.37…
1) Graph 1: plot t on the abscissa versus y on the ordinate and (artistically) draw a smooth line through the points. The line need not actually go through each data point.
2) Graph 2: plot t^2 on the abscissa versus y on the ordinate and then perform a linear regression. Remember to plot both the raw data points and the line of best fit (with the two points used to draw it); also show the regression equation and r value on the graph.
3) On graph (1), what does the slope of the line tell you about the velocity of the ball? Be thorough!
4) On graph 2:
a) What does the slope of the line tell you about the acceleration of the ball? Be thorough!
b) Calculate g from the freefall data and the % error (in comparison to 9.81 m/s^2) using the results from the linear regression calculation.
c) What do the values of the y-intercept and correlation coefficient (r) tell you?
Calculate the average fall time and standard deviation using the data above.
Average - 1.5s
Stdev- 1.85s
Use the average fall time and one of the kinematic equations to determine the height of the building.
Add the standard deviation from step 1 to the average fall time from step 2. This represents a “maximum fall time.” Use this time to calculate the “maximum” height of the building.
Chapter 14 Solutions
Thinking Like an Engineer: An Active Learning Approach (4th Edition)
Ch. 14.1 - The following table lists the number of computer...Ch. 14.2 - For the following mass data g1ven in units of...Ch. 14.2 - For the following temperature data given in units...Ch. 14.3 - For each of the following graphs, decide if the...Ch. 14.3 - Use the scenario described in Example 14-4. For...Ch. 14.4 - Consider the weight of shipping boxes sent down an...Ch. 14.4 - Prob. 7CCCh. 14.5 - Prob. 8CCCh. 14 - For the following pressure data, recorded in units...Ch. 14 - A technician tested two temperature probes by...
Ch. 14 - One of the NAE Grand Challenges for Engineering is...Ch. 14 - You use the data from the Mauna Loa observatory in...Ch. 14 - Polyetheretherketone (PEEK)TM polymers are...Ch. 14 - A technician tested a temperature probe by...Ch. 14 - During November, the heading system in your...Ch. 14 - You are assigned to inspect metal-composite beam...Ch. 14 - Use the scenario described in the preceding...Ch. 14 - You test several temperature probes by inserting...Ch. 14 - Use the scenario described in the previous Problem...Ch. 14 - Prob. 14ICACh. 14 - The following data were collected from a...Ch. 14 - The following data were collected from a...Ch. 14 - The following table lists the number of resin...
Knowledge Booster


Learn more about
Need a deep-dive on the concept behind this application? Look no further. Learn more about this topic, mechanical-engineering and related others by exploring similar questions and additional content below.Similar questions
- Part 1 1. In a study of ground motion caused by earthquakes, the velocity (in m/s) and the acceleration (in) were recorded for five earthquakes. The results are presented in the following table and compute the variance and standard deviation of the acceleration of these samples and explain their meaning. Velocity 1.54 1.60 0.95 Acceleration 5.64 6.04 6.04 1.3 2.92 4.37 3.00arrow_forwardusing the sine bar technique, find the value of the angle for the given data: the stacked height was composed of the following values, 30, 20, 5, 2 and 1.1 mm. The length of the sine bar is 150 mm. Support your answer by sketch.arrow_forwarddocuments from ICloOud. QUESTION 16 An interval recorded 9 occurrences. What is the 93% upper confidence limit(one-sided) for the number of occurrences in an interval? Please use at least 2 decimal points for your answer.arrow_forward
- Record the dimensions of the known (calibration) block using the caliper and dial gauge on the table below. Indicate the units of each measurement. Calculate the average length of each side of the block. Dimension Caliper (Units) 0.995 1.455 0.985 Ruler(in) A: 0.9 B: 1.5 C: 0.9 A B C Dimension A B Instrument Use the average dimensions (see Problem 2a) of the known block to calibrate the LVDT at your workstation. Record the voltage on the table below: LVDT Offset: 0.556 (Do not include the offset value in your average dimensions) C Ave Dimension (Units) (Dial Gauge) 0.997 1.659 0.949 0.964 in 1.538 in 0.945 in oltage Average Dimension 1.244 volt 1.994 1.28 0.964 in 1.538 in 0.945 inarrow_forwardMatch the terms precision and accuracy to their definitions. Precision 2 Accuracy Match each of the options above to the Items below. The number of significant digits or the closeness of different measurements of the same quantity to each other. The closeness of the measured or calculated value to the true value 1 2arrow_forwardA new electronic component for aircraft is tested to withstand temperatures as low as -50°F. One engineer suggests that the device cannot actually stand temperatures that low. What are the Type I and Type II errors? Type I: The device CAN NOT withstand temperatures as low as -50F but the engineer incorrectly finds that it CAN.Type II: The device CAN withstand temperatures as low as -50F but the engineer incorrectly finds that it CAN NOT. Type I: The device CAN withstand temperatures as low as -50F but the engineer incorrectly finds that it CAN NOT.Type II: The device CAN NOT withstand temperatures as low as -50F but the engineer incorrectly finds that it CAN. Is the answer the first or second bullet point?arrow_forward
- 5. A farmer has a 4-row, 101.6 cm planter. In 30 m of travel distance, the farmer finds that the planter meters an average of 200 seeds per row. What is the population? 6. In calibrating a 6-row, 76.2 cm row crop planter, an average of 610 seeds are counted in a row length of 131.2 m. What is the planting rate?arrow_forwardThe following graph shows a load-extension graph from a test on a polymer specimen 15mm in diameter and 45mm long. The rightmost datapoint represents the reading at the point of fracture. Load (KN) 20 15- 5- 0.2 0.4 Extension (mm) 0.6 a) 0.2% offset yield strength b) The tensile strength c) The modulus of elasticity 0.8 F Determine the following physical properties. Show all your working and express all your answers in appropriate Sl units where appropriate: 1.0 d) The % elongation e) The engineering stress at fracture f) Estimate the modulus of resiliencearrow_forwardThe data shown in Table 1 are the deviations from nominal diameter for holes drilled in a carbon-fiber composite material used in aerospace manufacturing. The values reported are deviations from nominal in ten-thousandths of an inch. (a) Set up and R charts on the process. Is the process in statistical control? (b) Estimate the process standard deviation using the range method. (c) If specifications are at nominal ±100, what can you say about the capability of this process? Calculate the PCR Cp Table 1. Hole Diameter Data Sample Number X1 X2 1 2 3 4 5 6 7 8 9 10 11 12 14 15 16 17 18 19 20 -30 +50 0 -50 -10 -10 +20 -40 0 0 -30 0 +20 0 0 +70 0 +10 +40 +30 +30 +30 +10 0 +20 +50 +50 -20 +50 -60 +10 0 0 +20 +10 -20 -10 0 +20 X3 X4 X5 -30 +20 +30 +50 +40 +20 +30 +20 +30 +20 +30 0 +20 +10 +40 +10 +10 -10 +50 -10 -30 -10 +50 +40 0 +30 -10 0 +30 +30 -20 +50 +30 +10 +40 +20 0 +30 +10 +30 -20 +30 +30 +20 -20 +50 +20 +10 -40 +20 -20 -10 -10 0 -20 +10 +10 +50 0 +10arrow_forward
- As an engineer working for a water bottling company, you collect the following data in order to test the performance of the bottling systems. Assume normal distribution. Milliliters of Water in the Bottle Frequency 485 490 milliliters 495 500 505 510 515 What is the mean (in milliliters)? milliliters What is the standard deviation (in milliliters)? What is the z value corresponding to 490 milliliters? Z = 6 12 20 33 18 11 00 8arrow_forward7. Why are land and groove markings on a bullet considered Class Evidence, while the striation markings on a bullet are consider Individual Evidence? 8. You recover two bullets from the wall of a crime scene. These recovered bullets are visible below: Bullet #1 Enlarged View Enlarged View Bullet #2 Actual Size Actual Size Bottom View Bottom View Bottom View Bottom View Complete the Evidence Table below. You can easily convert millimeters to inches (if needed) using the following formula: # of millimeters # of inches 25.4 mm per inch Firearm likely produced by what manufacturer? Approximate Bullet Evidence Table Direction of # of Lands Caliber Twist (English) Bullet #1 Bullet #2 Do you believe that Bullet #1 and Bullet #2 were fired from the same gun? 86arrow_forwardWeights measured in grams of randomly selected M&M plain candies: 0.957 0.912 0.925 0.886 0.920 0.958 0.915 0.914 0.947 0.939 0.842 What is the z-score for an M&M that weighs less than 0.866 grams? (round to the tenths place)arrow_forward
arrow_back_ios
SEE MORE QUESTIONS
arrow_forward_ios
Recommended textbooks for you
 Elements Of ElectromagneticsMechanical EngineeringISBN:9780190698614Author:Sadiku, Matthew N. O.Publisher:Oxford University Press
 Mechanics of Materials (10th Edition)Mechanical EngineeringISBN:9780134319650Author:Russell C. HibbelerPublisher:PEARSON
 Thermodynamics: An Engineering ApproachMechanical EngineeringISBN:9781259822674Author:Yunus A. Cengel Dr., Michael A. BolesPublisher:McGraw-Hill Education
 Control Systems EngineeringMechanical EngineeringISBN:9781118170519Author:Norman S. NisePublisher:WILEY
 Mechanics of Materials (MindTap Course List)Mechanical EngineeringISBN:9781337093347Author:Barry J. Goodno, James M. GerePublisher:Cengage Learning
 Engineering Mechanics: StaticsMechanical EngineeringISBN:9781118807330Author:James L. Meriam, L. G. Kraige, J. N. BoltonPublisher:WILEY
Elements Of Electromagnetics
Mechanical Engineering
ISBN:9780190698614
Author:Sadiku, Matthew N. O.
Publisher:Oxford University Press
Mechanics of Materials (10th Edition)
Mechanical Engineering
ISBN:9780134319650
Author:Russell C. Hibbeler
Publisher:PEARSON
Thermodynamics: An Engineering Approach
Mechanical Engineering
ISBN:9781259822674
Author:Yunus A. Cengel Dr., Michael A. Boles
Publisher:McGraw-Hill Education
Control Systems Engineering
Mechanical Engineering
ISBN:9781118170519
Author:Norman S. Nise
Publisher:WILEY
Mechanics of Materials (MindTap Course List)
Mechanical Engineering
ISBN:9781337093347
Author:Barry J. Goodno, James M. Gere
Publisher:Cengage Learning
Engineering Mechanics: Statics
Mechanical Engineering
ISBN:9781118807330
Author:James L. Meriam, L. G. Kraige, J. N. Bolton
Publisher:WILEY
Dimensional Analysis - in physics; Author: Jennifer Cash;https://www.youtube.com/watch?v=c_ZUnEUlTbM;License: Standard youtube license