
Videos
The comparative balance sheet of Prime Sports Gear, Inc., at December 31, the end of the fiscal year, is as follows:
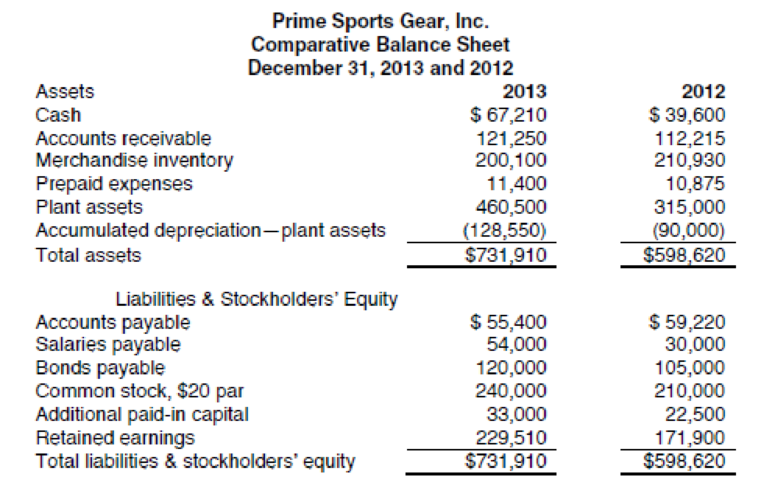
Additional data obtained from the records of Prime Sports Gear are as follows:
- a. Net income for 2013 was $121,610.
- b. Depreciation reported on income statement for 2013 was $46,500.
- c. Purchased $165,000 of new equipment, putting $90,000 cash down and issuing $75,000 of bonds for the balance.
- d. Old equipment originally costing $19,500, with
accumulated depreciation of $7,950, was sold for $8,000. - e. Retired $60,000 of bonds.
- f. Declared cash dividends of $64,000.
- g. Issued 1,500 shares of common stock at $27 cash per share.
You have been asked to prepare a statement of cash flows for Prime Sports Gear for 2013. Review the worksheet called CASHFLOW that has been provided to assist you in preparing the statement. The worksheet has been designed so that as you make entries in columns D and F, column G will be automatically updated. For example, FORMULA1 should be entered as =B17+D17–F17. Columns C and E are to be used to enter letter references for each of the debit and credit entries on the worksheet.
Prepare the statement of cash flow for Incorporation PSG and review the worksheet.
Explanation of Solution
Prepare the statement of cash flow for Incorporation PSG and review the worksheet.
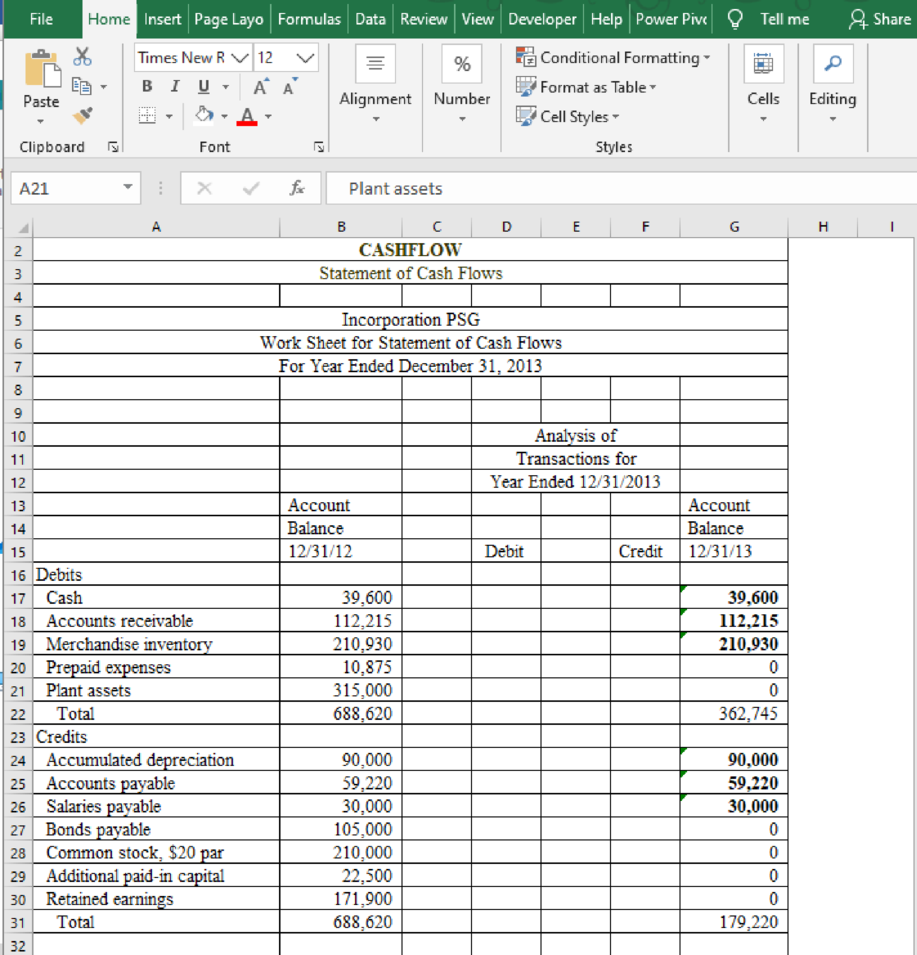
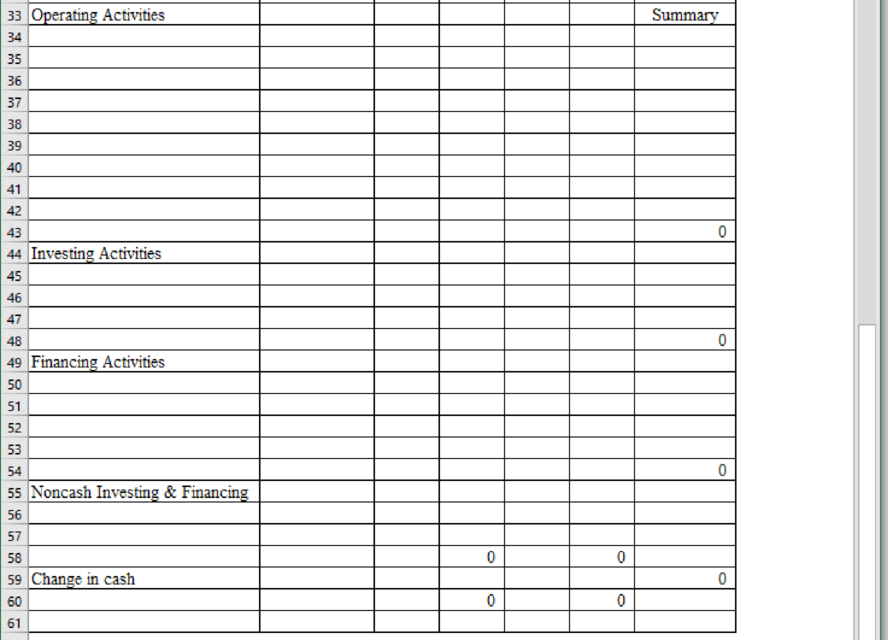
Table (1)
Want to see more full solutions like this?
Chapter 14 Solutions
Excel Applications for Accounting Principles


- Financial information for Powell Panther Corporation is shown below: Powell Panther Corporation: Income Statements for Year Ending December 31 (Millions of Dollars) 2018 Sales $ 1,625.0 $ 2017 1,300.0 Operating costs excluding depreciation and amortization 1,300.0 1,105.0 EBITDA $ 325.0 $ 195.0 Depreciation and amortization 39.0 31.0 Earnings before interest and taxes (EBIT) $ 286.0 $ 164.0 Interest 36.0 29.0 Earnings before taxes (EBT) $ 250.0 $ 135.0 Taxes (40%) 100.0 54.0 Net income $ 150.0 $ 81.0 Common dividends $ 135.0 $ 65.0 Powell Panther Corporation: Balance Sheets as of December 31 (Millions of Dollars) 2018 Assets Cash and equivalents $ 23.0 $ 2017 18.0 Accounts receivable 164.0 143.0 Inventories 343.0 312.0 Total current assets $ 530.0 $ 473.0 Net plant and equipment 390.0 312.0 Total assets $ 920.0 $ 785.0 Liabilities and Equity…arrow_forwardCardinal Industries had the following operating results for 2018: Sales = $34,318; Cost of goods sold = $24,212; Depreciation expense = $5,997; Interest expense = $2,710; Dividends paid = $1,996. At the beginning of the year, net fixed assets were $19,940, current assets were $7,054, and current liabilities were $3,992. At the end of the year, net fixed assets were $24,502, current assets were $8,684, and current liabilities were $4,673. The tax rate for 2018 was 22 percent. a. What is net income for 2018? (Do not round intermediate calculations.) b. What is the operating cash flow for 2018? (Do not round intermediate calculations.) c. What is the cash flow from assets for 2018? (Do not round intermediate calculations. A negative answer should be indicated by a minus sign.) d-1. If no new debt was issued during the year, what is the cash flow to creditors? (Do not round intermediate calculations.) d-2. If no new debt was issued during the year, what is the cash flow…arrow_forwardFinancial statement data for Fred's Fish House are given below. All figures are in thousands of dollars. Use this data to construct a Balance Sheet for the company for the year ending December 31, 2010. Gross fixed assets Accounts payable Accruals 2,940 340 90 Accumulated depreciation Additional paid in capital Beginning of year inventory Cash 810 840 780 310 COGS 6,420 Common stock ($1 par value) Current portion of LT Debt Gross Accounts receivable 220 110 432 Inventory LT Debt (excluding current portion) Notes payable Purchases 940 1,280 120 6,580 790 Retained earnings Allowances for doubtful accounts 22arrow_forward
- Laflamme Inc. had the following operating results for 2018: sales $30,660; cost of goods sold = $20.260, depreciation expense = $5,660: interest expense = $3.090; dividends paid = $1,950. At the beginning of the year, net fixed assets were $17,480, current assets were $5.960, and current liabilities were $3.575. At the end of the year, net fixed assets were $21,160, current assets were $7,180, and current liabilities were $4,100. The tax rate for 2018 was 30 %. a. What is net income for 2018? (Negative answers should be indicated by a minus sign. Omit $ sign in your response.) Net income b. What is the operating cash flow for 2018? (Negative answers should be indicated by a minus sign. Omit $ sign in your response.) Operating cash flow c. What is the cash flow from assets for 2018? (Negative answer should be indicated by a minus sign. Omit $ sign in your response.) Cash flow from assets d. If no new debt was issued during the year, what is the cash flow to creditors? What is the cash…arrow_forwardConsider the following balance sheet for Go The Distance Trading Cards. Sales were $1,200,000 in the past year. Go The Distance Trading Cards Balance Sheet, 2013: Assets $ Current Assets $74,630.00 Net fixed Assets (Net PPE) $224,900.00 Total Assets $299,530.00 Liabilities and Shareholder Equity Current Liabilities $43,510.00 Long-term liabilities (Long term debt) $93,200.00 Total Liabilities $136,710.00 Shareholder equity $162,820.00 Total Liabilities and Shareholder Equity $299,530.00 What is the debt-to-asset ratio for this firm?arrow_forwardČardinal Industries had the following operating results for 2018: Sales = $34,621; Cost of goods sold Dividends paid = $2,023. At the beginning of the year, net fixed assets were $19,970, current assets were $7,075, and current liabilities were $4,01O. At the end of the year, net fixed assets were $24,529, current assets were $8,702, and current liabilities were $4,700. The tax rate for 2018 was 25 percent. $24,359; Depreciation expense = $6,027; Interest expense $2,725; %3D a. What is net income for 2018? (Do not round intermediate calculations.) b. What is the operating cash flow for 2018? (Do not round intermediate calculations.) c. What is the cash flow from assets for 2018? (Do not round intermediate calculations. A negative answer should be indicated by a minus sign.) d- If no new debt was issued during the year, what is the cash flow to creditors? (Do not 1. round intermediate calculations.) d- If no new debt was issued during the year, what is the cash flow to stockholders? (Do…arrow_forward
- Ivanhoe Automotive’s balance sheet at the end of its most recent fiscal year shows the following information: Ivanhoe AutomotiveBalance Sheet as of March 31, 2017 Assets: Liabilities and Equity: Cash and marketable sec. $40,000 Accounts payable and accruals $168,000 Accounts receivable 158,000 Notes payable 27,000 Inventory 232,000 Total current assets $430,000 Total current liabilities $195,000 Long-term debt 172,000 Total liabilities $367,000 Net plant and equipment 780,000 Common stock 317,000 Goodwill and other assets 92,000 Retained earnings 618,000 Total assets $1,302,000 Total liabilities and equity $1,302,000 In addition, it was reported that the firm had a net income of $159,000 on net sales of $4,200,000.Excel Template(Note: This template includes the problem statement as it appears in your textbook. The problem assigned to you here may have different values. When using…arrow_forwardadux Candy Company's income statement for the year ended December 31, 2024, reported interest expense of $21 million and income tax expense of $11 million. Current assets listed in its balance sheet include cash, accounts receivable, and inventory. Property, plant, and equipment is the company's only noncurrent asset. Financial ratios for 2024 are listed below. Profitability and turnover ratios with balance sheet items in the denominator were calculated using year-end balances rather than averages. Debt to equity ratio Current ratio Acid-test ratio Times interest earned ratio Return on assets Return on equity Profit margin on sales. Gross profit margin (gross profit divided by net sales). Inventory turnover Receivables turnover Assets Current assets: Cash CADUX CANDY COMPANY Balance Sheet At December 31, 2024 (5 in millions) Accounts receivable (net) Inventory Total current assets Property, plant, and equipment (net) Total assets AL 1.0 2.0 1.0 Required: Prepare a December 31, 2024,…arrow_forwardPrepare a 2015 statement of financial position for Lowes Corp. based on the following information: cash = $195,000, patents and copyrights = $780,000, accounts payable = $405,000, accounts receivable = $137,000, tangible net fixed assets = $2,800,000, inventory = $264,000, notes payable = $160,000, accumulated retained earning = $1,934,000, long-term debt = $1,195,000. Be sure to list the accounts in order of their liquidity.arrow_forward
- Cadux Candy Company's income statement for the year ended December 31, 2024, reported interest expense of $3 million and income tax expense of $20 million. Current assets listed in its balance sheet include cash, accounts receivable, and inventory. Property, plant, and equipment is the company's only noncurrent asset. Financial ratios for 2024 are listed below. Profitability and turnover ratios with balance sheet items in the denominator were calculated using year-end balances rather than averages. Debt to equity ratio Current ratio 0.8 2.0 Acid-test ratio 1.0 Times interest earned ratio 16 times Return on assets 20% Return on equity 36% Profit margin on sales 10% Gross profit margin (gross profit divided by net sales) 20% Inventory turnover 8 times Receivables turnover 21 times Required: Prepare a December 31, 2024, balance sheet for the Cadux Candy Company. Note: Enter your answers in millions. Round your intermediate calculations and final answer to the nearest whole million. CADUX…arrow_forwardCadux Candy Company's income statement for the year ended December 31, 2024, reported interest expense of $3 million and income tax expense of $20 million. Current assets listed in its balance sheet include cash, accounts receivable, and inventory. Property, plant, and equipment is the company's only noncurrent asset. Financial ratios for 2024 are listed below. Profitability and turnover ratios with balance sheet items in the denominator were calculated using year-end balances rather than averages. Debt to equity ratio Current ratio 0.8 2.0 Acid-test ratio Times interest earned ratio 1.0 16 times Return on assets 20% Return on equity 36% Profit margin on sales 10% Gross profit margin (gross profit divided by net sales) 20% Inventory turnover 8 times Receivables turnover 21 times Required: Prepare a December 31, 2024, balance sheet for the Cadux Candy Company. Note: Enter your answers in millions. Round your intermediate calculations and final answer to the nearest whole million. CADUX…arrow_forwardThe balance sheet of Huan Corporation reported net fixed assets of $332,000 at the end of 2018. The fixed- asset turnover ratio for 2018 was 4.0, and sales for the year totaled $1,540,000. Net fixed assets at the end of 2017 were: A. $491,000. B. $385,000. C. $438,000 D. $408,000arrow_forward
 Excel Applications for Accounting PrinciplesAccountingISBN:9781111581565Author:Gaylord N. SmithPublisher:Cengage Learning