2. An ecologist began studying a certain type of plant species in a wetlands area in 2013. In 2015 (t=2), there were 59 plants. In 2021 (t = 8), there were 118 plants. The number of plants in this species can be modeled by the function P given by P(t)= ab', where P(t) is the number of plants during year t, and t is the number of years since 2013. (A) (i) Use the given data to write two equations that can be used to find the values for constants a and b in the expression for P(t). (ii) Find the values for a and b as decimal approximations. (B) (i) Use the given data to find the average rate of change of the number of plants, in plants per year, from t = 2 to t=8 years. Express your answer as a decimal approximation. Show the computations that lead to your answer. (ii) Use the average rate of change found in (i) to estimate the number of plants for t=10 years. Show the work that leads to your answer. (iii) The average rate of change found in (i) can be used to estimate the number of plants during year t for t>10 years. Will these estimates, found using the average rate of change, be less than or greater than the number of plants predicted by the model P during year t for t>10 years? Explain your reasoning. (C) For which t-value, t = 6 years or t = 20 years, should the ecologist have more confidence in when using the model P? Give a reason for your answer in the context of the problem.
2. An ecologist began studying a certain type of plant species in a wetlands area in 2013. In 2015 (t=2), there were 59 plants. In 2021 (t = 8), there were 118 plants. The number of plants in this species can be modeled by the function P given by P(t)= ab', where P(t) is the number of plants during year t, and t is the number of years since 2013. (A) (i) Use the given data to write two equations that can be used to find the values for constants a and b in the expression for P(t). (ii) Find the values for a and b as decimal approximations. (B) (i) Use the given data to find the average rate of change of the number of plants, in plants per year, from t = 2 to t=8 years. Express your answer as a decimal approximation. Show the computations that lead to your answer. (ii) Use the average rate of change found in (i) to estimate the number of plants for t=10 years. Show the work that leads to your answer. (iii) The average rate of change found in (i) can be used to estimate the number of plants during year t for t>10 years. Will these estimates, found using the average rate of change, be less than or greater than the number of plants predicted by the model P during year t for t>10 years? Explain your reasoning. (C) For which t-value, t = 6 years or t = 20 years, should the ecologist have more confidence in when using the model P? Give a reason for your answer in the context of the problem.

Chapter6: Exponential And Logarithmic Functions
Section6.1: Exponential Functions
Problem 57SE: Repeat the previous exercise to find the formula forthe APY of an account that compounds daily....

Related questions
Question
Transcribed Image Text:2.
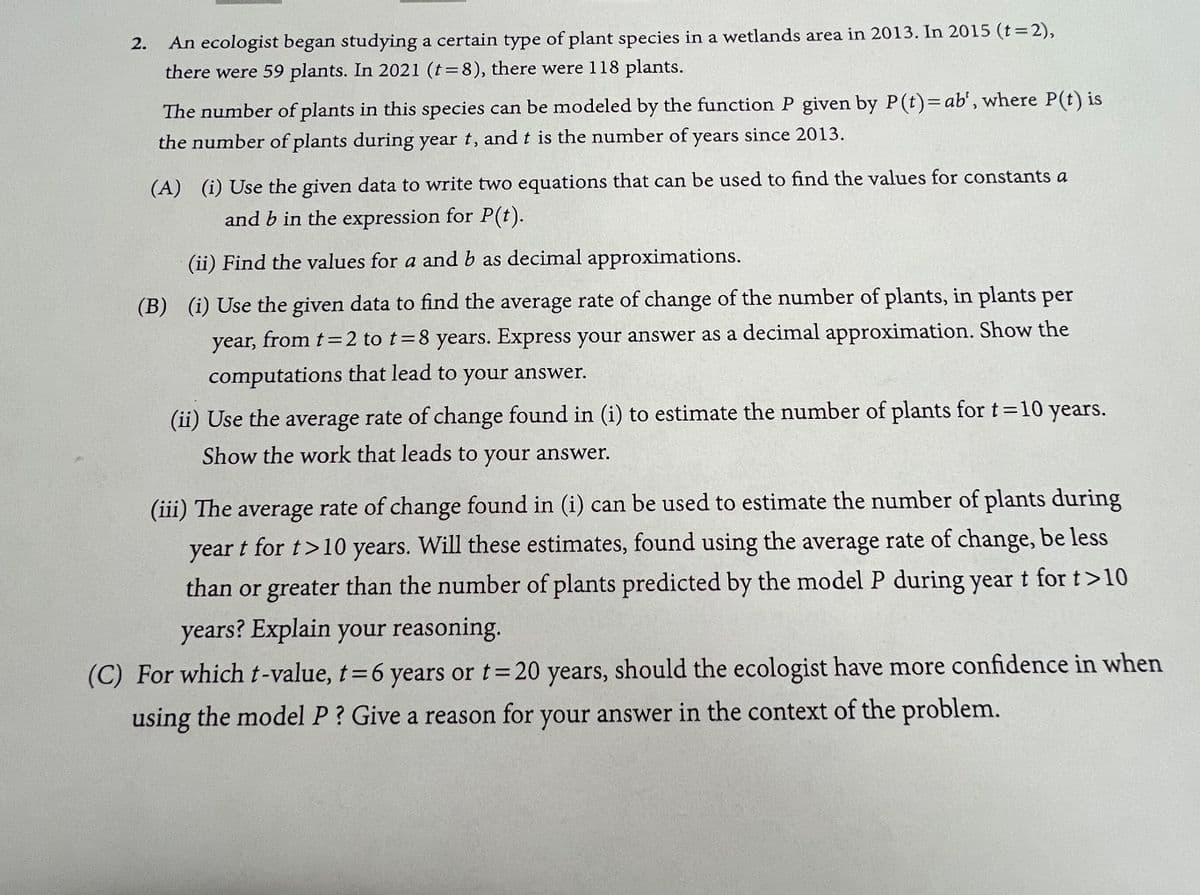
An ecologist began studying a certain type of plant species in a wetlands area in 2013. In 2015 (t=2),
there were 59 plants. In 2021 (t = 8), there were 118 plants.
The number of plants in this species can be modeled by the function P given by P(t)= ab', where P(t) is
the number of plants during year t, and t is the number of years since 2013.
(A) (i) Use the given data to write two equations that can be used to find the values for constants a
and b in the expression for P(t).
(ii) Find the values for a and b as decimal approximations.
(B) (i) Use the given data to find the average rate of change of the number of plants, in plants per
year, from t = 2 to t=8 years. Express your answer as a decimal approximation. Show the
computations that lead to
your
answer.
(ii) Use the average rate of change found in (i) to estimate the number of plants for t=10 years.
Show the work that leads to your answer.
(iii) The average rate of change found in (i) can be used to estimate the number of plants during
year t for t>10 years. Will these estimates, found using the average rate of change, be less
than or greater than the number of plants predicted by the model P during year t for t>10
years? Explain your reasoning.
(C) For which t-value, t = 6 years or t = 20 years, should the ecologist have more confidence in when
using the model P? Give a reason for your answer in the context of the problem.
AI-Generated Solution

Unlock instant AI solutions
Tap the button
to generate a solution
Recommended textbooks for you


Algebra & Trigonometry with Analytic Geometry
Algebra
ISBN:
9781133382119
Author:
Swokowski
Publisher:
Cengage
Algebra & Trigonometry with Analytic Geometry
Algebra
ISBN:
9781133382119
Author:
Swokowski
Publisher:
Cengage

Algebra and Trigonometry (MindTap Course List)
Algebra
ISBN:
9781305071742
Author:
James Stewart, Lothar Redlin, Saleem Watson
Publisher:
Cengage Learning